
Download pdf: Potash implications of baling straw (1.63M)
pdf 1.63M
Potash implications of baling straw
September 2019
Last harvest there were quite a lot of last-minute decisions to bale as a result of anticipated straw shortages and higher prices. Baling and removing straw, where there is no specific requirement for other enterprises on the farm, can often be a sensible agronomic and economic decision. These include high level of residue on the surface which may reduce the establishment of the following crop, or straw prices that are sufficient to cover the costs of baling and replacement of nutrients and organic matter. This last calculation is often not considered in enough detail and will depend on the price of phosphate and potash required to replace what is removed, and being able to allocate a cost to organic matter.
Whatever the reasoning for the decision, where straw is removed it is important to fully account for everything that is being taken off the field, which can be a large quantity of potash. Removing winter cereal straw nearly doubles the amount of potash taken off, compared with removing the grain alone. Potash recommendations do not mirror that of nitrogen, where applications are required annually to meet the economic optimum yield. They can be dealt with rotationally, but any large discrepancies between planned actions and what actually happens at harvest, need accounting for to ensure soil levels do not drop too low.
Last year, the dry conditions meant that average offtake values for K in straw significantly underestimated the amount of potash being removed. This year, the higher straw yields may do similar if basing offtake on grain yield alone. Where straw yield is known, RB209 gives average values for P&K removed per tonne of straw. Whichever method is used it should be remembered that potash content of straw can vary greatly. Drier than average conditions between crop maturity and baling straw will increase straw potash content, whereas higher than average rainfall is likely to have the opposite impact.
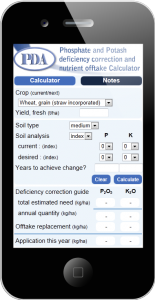
P&K Nutrient Calculator
It is calculated that it could take between 10 and 20 years to change the nutrient status of a soil from Index 1 to 2 if only the additional 30 kg/ha as suggested in the Fertiliser Manual (RB209) is added to the crop offtake when making a phosphate or potash recommendation for deficient soils. It cannot be considered economic (or environmental) good practice to tolerate a nutrient deficiency over such a long period and the PDA Calculator provides an alternative approach.
Yield relationship curves for phosphate and potash have previously been published in AHDB Report 485 (see Figure 1).
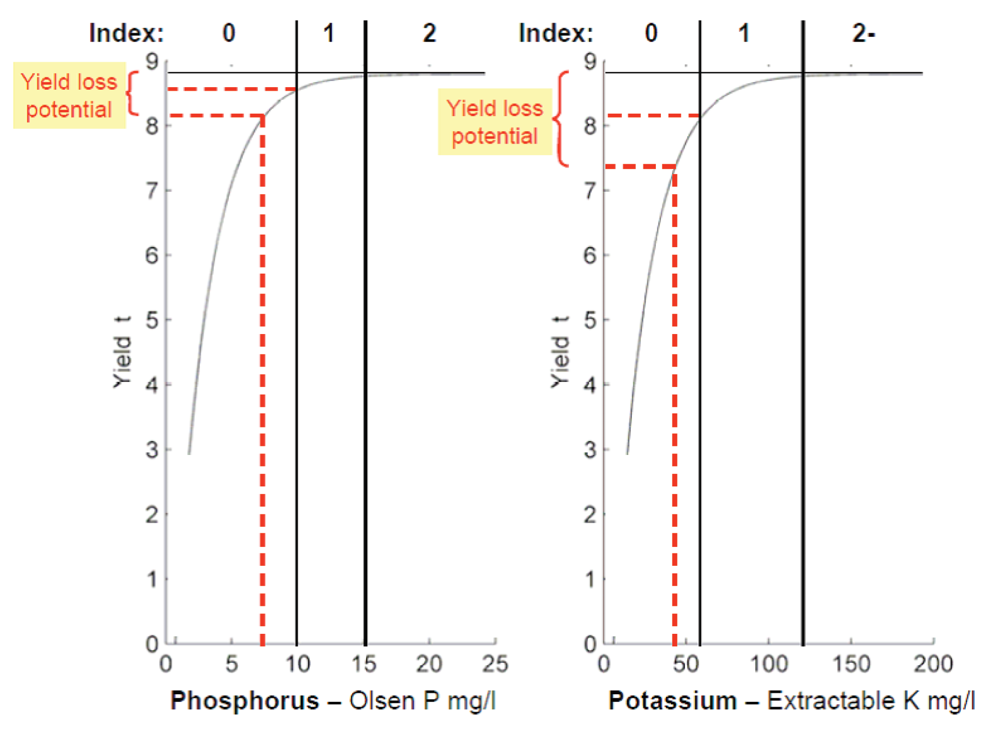
Figure 1. Fitted wheat yield relationship curves for P and K, showing the Index ranges and the potential yields at the bottom of Index 1 and in the upper half of Index 0.
Compared with a soil at the standard target Indices, these show potential wheat yield reductions of 0.75 t/ha for soils in the upper half of P Index 0 and of 1.3 t/ha for soils in the upper half of K Index 0. At a grain price of £150/tonne these yield reductions could cost £113/ha and £195/ha respectively (Table 1).
It is clear from Table 1 (which is derived from Figure 1) that there is a considerable potential yield and income loss on soils with below the optimal or target Index. In order to help farmers and growers to correct soil nutrient deficiencies more quickly, and so lessen the time over which a field is at risk of significant yield loss, the PDA Calculator was developed to provide an indication of the nutrients required for correction, and the annual applications needed over a chosen number of years.
| Bottom of Index 1 | Top half of Index 0 | |||
| Yield reduction vs. soil at Index 2 |
Income lost per year, wheat grain @£150/t |
Yield reduction vs. soil at Index 2 |
Income lost per year, wheat grain @£150/t |
|
| Phosphorus | 0.25 t/ha | £38 | 0.75 t/ha | £113 |
| Potassium | 0.7 t/ha | £105 | 1.3 t/ha | £195 |
| Table 1: Potential financial implications for an 8.8 t wheat crop on nutrient deficient soils. | ||||
The PDA P&K Nutrient Calculator is now available as an app on Apple and Android devices as well as online at the PDA website. The Calculator has two main functions.
- It enables a quick calculation of the phosphate (P2O5) and potash (K2O) offtakes by most UK crops at harvest.
- If soil Indices are below the target level the second section of the Calculator provides a guide to the quantity of nutrient which is likely to be required to correct the deficiency. This will vary according to the level of deficiency and the soil type. The quantity will usually be more than can reasonably be applied in one season, and the Calculator asks by how much and how quickly you want to correct the deficiency, i.e. over how many years. The desired improvement can be input by Index or more precisely by mg/litre as determined by soil analysis.
The Calculator displays the nutrients required to replace the offtake at harvest, and shows separately the guide quantity of phosphate and or potash needed to correct the deficiency. This separate display of the two components of the fertiliser recommendation is important because the crop should pay for the nutrients removed at harvest, but not for the correction of the deficiency. This fertiliser should be spread over multiple years, as would be the case for liming and drainage costs.
It is important to read the notes attached to the Calculator. Large single applications of phosphate must be made with care to avoid losses to watercourses through surface run-off or via cracking clay soils. It is recommended that deficiency-correcting applications of phosphate should not usually exceed 100 kg P2O5/ha per year.
The Calculator gives guide results only; the effects of applications of fertilisers or manures must be checked by regular soil analysis. The Calculator cannot be used to indicate timescales for any reductions in Indices higher than target.
Once the soil has been brought to the appropriate K Index for the rotation it should be maintained by replacing the amount of K removed in the harvested crop. This can be calculated from the yield and the concentration of K in the crop. The latter can be found in tables published in RB209 or in PDA leaflet Phosphate and Potash Removal by Crops. These published K concentrations are averages (as demonstrated in the article on the first page) so it may be that slightly too much or too little will be applied as a maintenance (M) or replacement dressing each year. Consequently, it is sensible to check that potash applications are maintaining the correct level of plant-available K in the soil. This can be done by taking a soil sample every 4 or 5 years from each fi eld for analysis.
Preferably, sampling should always be done at the same point in the rotation, at the same time of year and to the same depth.
It should be recognised that potash is unlike most other farm inputs, which are justified on the basis of direct yield response and financial return per £ spent. Correct use of potash to replace crop offtake and maintain soil reserves may not result in an immediate yield response. Failure to replace the potassium removed in the crop and maintain an adequate soil reserve jeopardises future yields and crop quality and unnecessarily exposes the response to all other inputs.
Policies for the lightest textured soils (sands and loamy sands) should be to ensure at least the replacement of removals without the expectation of raising the inherently low levels of soil K to the same values as for other soils.
Benefits of maintaining soil fertility
- Fertile soils have a better distribution of nutrients throughout the soil profile, resulting in more effective uptake, particularly for poorer rooting crops (e.g. potatoes), and better yields than can be achieved from low soil fertility and high fertiliser regimes.
- Soils with adequate nutrient levels avoid the risk of damage to roots from local, high concentrations of salts from large fertiliser applications.
- Satisfactory fertility removes the urgency of timeliness in application of fertilisers, which eases peak work-loads and allows applications to be undertaken at times that will not risk causing damage to soil structure or seedbeds.
- Shortages of any secondary nutrients (e.g. P, K, S, and Mg) will result in poorer responses to nitrogen.

Spring Potash Trials
The yield testing arm of the YEN is funded by the European Innovation Partnership (EIP) scheme to run on-farm experimentation testing yield enhancing ideas. ADAS are currently running FIGs testing ideas around amino acids, spring potash, canopy longevity, crop momentum and soil management, which will run over two seasons.
YEN Spring Potash Farmer Innovation Group (FIGs) is testing the potential yield benefit of a spring application of Potash, specifically to improve both crop drought tolerance and crop nitrogen uptake. The table below presents tissue nitrogen concentrations from the most recent sampling time point, from the three treatments of untreated (0 kg/ha MOP), 100 kg/ha MOP and 200 kg/ha MOP. The data shows evidence of a rate response, with more MOP applied resulting in greater crop nitrogen uptake.
| Growth Stage | Kg/ha MOP | FIG member 1 – %N | FIG member 2 – %N | FIG member 3 – %N |
|---|---|---|---|---|
| GS59 | 0 | 4.06 | 4.12 | 2.09 |
| 100 | – | 4.21 | 2.20 | |
| 200 | 4.55 | 4.41 | 2.39 |