
Download pdf: Impact of pH on nutrient availability (1.84M)
pdf 1.84M
Impact of pH on nutrient availability
October 2022
Under the Farming Rules for Water, introduced in 2018, there is a requirement to test soils for nutrient levels (and pH) every 3-5 years, so it is reassuring that the vast majority of respondents to a recent farmer survey carried out by Crop Production Magazine, in conjunction with ICL, comply with this (93%). And of those that are sampling, it is primarily the basic soil analysis that is completed, where measurements of phosphorus, potassium, magnesium and pH are taken. However, soil analysis is clearly only the starting point. What is done with the information gathered is the important part, and judging by the many PAAG results, there is still some way to go to ensure that soils are managed appropriately for the measurements recorded.
When it comes to crop nutrition, soil pH must be considered the starting point, as the availability of all nutrients are affected by the pH of the soil. The optimum availability of most plant nutrients occurs around a neutral pH of 6.5 to 7, however the optimum pH for soils will vary depending on the soil type and the cropping. For most mineral soils it is 6.0 for permanent pasture, through to 6.5 for continuous arable cropping. A pH of at least 6.5 should be considered where acid sensitive crops are grown in the rotation, such as sugar beet.
Clovers also require an adequate pH and will not thrive at the lower pH tolerated by grass; mixed grass/clover swards should be maintained between pH 6 and 6.5. At low soil pH, clovers may not nodulate effectively and their ability to fix nitrogen is reduced; at very low pH levels, clovers may fail to nodulate completely.
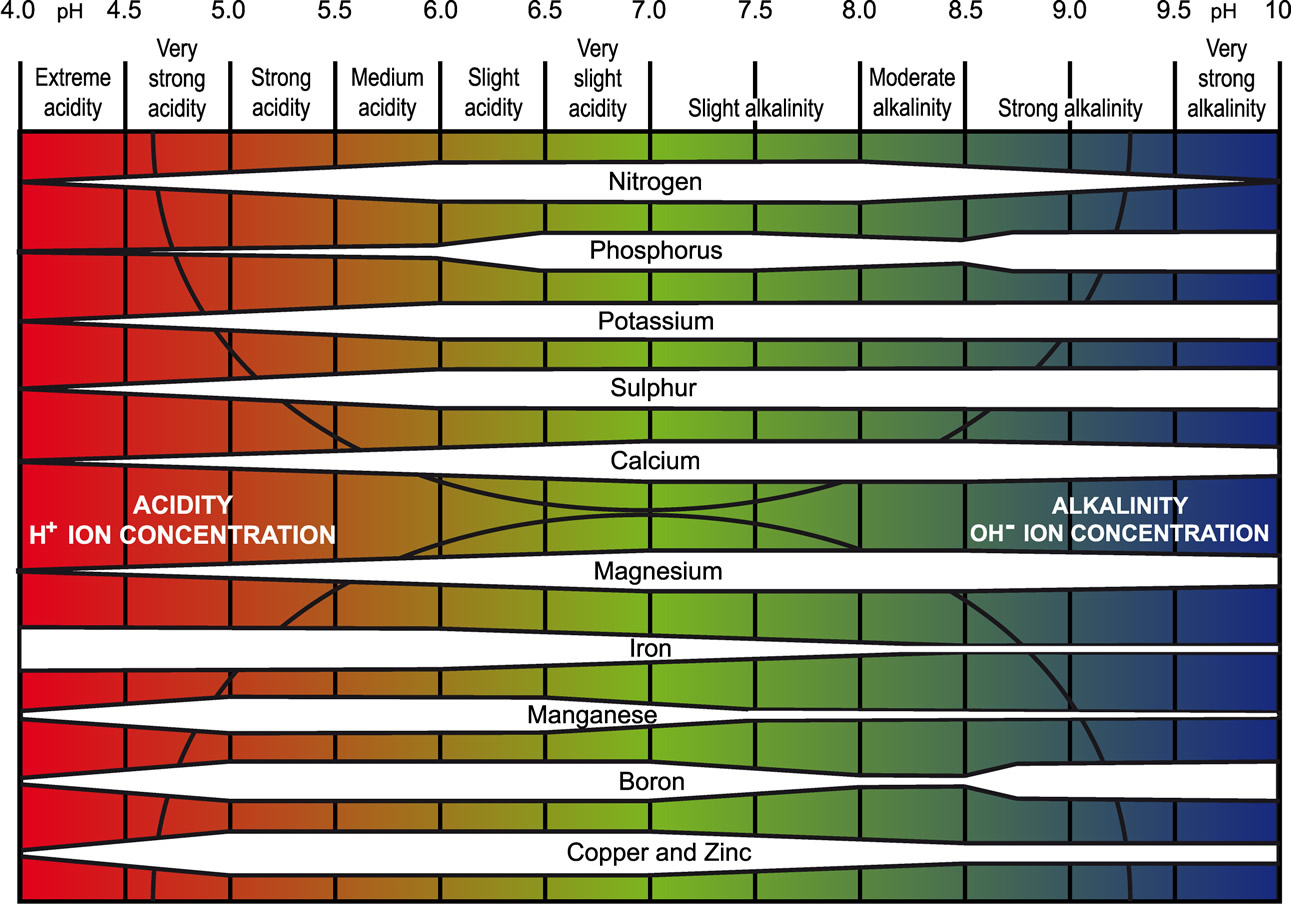
Since soil pH is measured on a logarithmic scale, a drop of just 1 pH value increases the level of acidity 10-fold. For this reason, any drop in pH from the optimum range can have a large impact on the availability of some nutrients (Figure 1).
In arable soils, some 37% of soils sampled in the latest PAAG (Professional Agricultural Analysis Group) data fall below the optimum pH of 6.5-7, although the majority of these fall just short (6-6.5). In grassland soils the percentage of soils falling below the lower optimum of 6-6.5 is even higher, at 50%. Figure 2 below shows the impact on the availability of phosphate and potash at reducing pH values from 7 (increasing acidity). Clearly phosphate availability appears to be affected the most, but even potash is only around 50% available below a pH of 5.5. Considering the vast quantities of potash required by crops, up to 500kg/ha depending on the crop, any reduction in the availability will have a significant impact on the crops ability to utilise soils reserves, regardless of any additions.

There can be large variation in soil pH across a field, so the accuracy of the soil sampling is also important to ensure that the results are truly representative of the area measured.
Rainfall, which is naturally slightly acidic, ammonium nitrogen and root exudates will all contribute to the natural acidification of soil, but not to the extent of reducing the pH of high pH soils. These factors are more likely to be detrimental to naturally acidic and neutral soils than they are beneficial in naturally alkaline soils.
It is not difficult to raise the pH of acidic soils, this can be achieved using liming materials. Those most often used are ground calcitic or magnesian (Dolomitic) limestone, chalk or sugar beet lime etc., but as these materials often supply large quantities of either calcium or magnesium, the choice of product should also be influenced by the magnesium status of the soil.
Phosphate & Potash Levels
Looking at levels of phosphate and potash in the soil, the PAAG data shows that only half of all soils are at or above the target index for both phosphate and potash. This means a significant proportion of soils are below the target level for one (35%) or both (14%) nutrients. This does not marry up well with the fact that two thirds of the respondents to the survey suggested they either did not use any phosphate or potash fertiliser in the last twelve months or had reduced either one or both.
The availability of nutrients from the soil reserves will be reduced if the pH is sub-optimal, with this problem being more serious if nutrient levels are below Index 2. On soils with low nutrient reserves, especially where they are also acidic, if nutrient applications are being reduced or omitted, yields are going to suffer as a result, increasing the cost of production in a time of increasing input costs and lower returns.
In grassland situations potash is critical to the efficient uptake and utilisation of nitrogen and it is well established that grassland grown on a soil with a K index of 1 or 0 will yield 20% to 30% less grass dry matter than that grown on K soil index 2- and 2+. Even at modest yields of 10t DM/ha over a season and energy contents averaging 11 MJ ME/kg DM, this can represent an energy loss to the milk or meat production system of 33,000 MJ of ME/ha.
At a grazing utilisation rate of 80%, this means that a 26,400 MJ of ME/ha opportunity is lost from milk and meat production. This amount of energy could produce 4,900 litres of milk (at 5.3 MJ ME/litre milk) or 560 kg of liveweight gain (at 47 MJ ME/kg liveweight). In terms of supplementary feed, this amount of energy could be replaced by buying 2.15 tonnes of a 12.3 MJ ME/kg DM cereal-based concentrate. However, this supplementation would cost significantly more than the equivalent home-grown forage.
These ‘potential losses’ in dry matter, energy and the associated increased costs will depend on the production system, but this aims to illustrate that it is cost efficient to get soil K index right in the fi rst place and avoid the losses to the system.
Correcting Deficiencies
Correcting a nutrient deficiency is challenging to achieve in the short term, however it can be even more costly if not addressed. Fertiliser recommendations for phosphate and potash are built up from immediate removal by the crop being grown (a maintenance or removal figure) plus an adjustment for soil index (additional for a 0 or 1, a reduction for anything over 2/2-). The standard adjustment values can be modified to build up an index over a shorter or longer time period using the PDA P&K Nutrient Calculator.
As discussed earlier, the first step to ensuring crops receive optimal nutrition, and thereby helping to reduce the unit cost of production, is to ensure the correct soil pH. Once this is corrected, achieving target soil index is the next consideration. Where soils are below the target, one option in times of high input prices could be to extend the number of years to build-up the index to reduce the annual cost. Although it should be noted that this will leave the crops grown over that time period vulnerable to sub optimal yields, it would at least reduce the possibility of soils slipping further and costing more in the long run to build back up.