5b. Results from Grass Demonstration Plots (912.44K)
pdf 912.44K
5b. Results from Grass Demonstration Plots
Published December 2004
Background
Crops of grass were grown on small unreplicated plots in the Arable Area of the National Agricultural Centre, Stoneleigh. The same treatments were used on the same plots for each of the 4 years; 1987-1990. Three cuts were taken each year at silage stage and crops were weighed and analysed. Soil was sampled in the autumn before the first harvest year and in each autumn of the comparison.
The soil was a light sandy loam with an available soil K level of 93 mg/l (index 1) at the start of the work. This K status is typical of over one third of soils in the UK.
Whilst the plots were not replicated the general conclusions from this work are clear and confirm results from fully replicated scientific experiments elsewhere.
It was not the purpose of this work to determine the optimum rate of potash to use on this site but merely to demonstrate the effect of different levels of potash fertiliser on yield, herbage content and soil fertility.
Treatments
Three potash treatments were applied to the same plots in 1987, 1988, 1989 and 1990:
| K0 nil |
K1 160 kg K2O/ha |
K2 320 kg K2O/ha |
All other inputs were identical for all three plots. No FYM/slurry was applied before or during the study. Plots were cut for three crops of silage each year except in 1990 when conditions were too dry for a third cut.
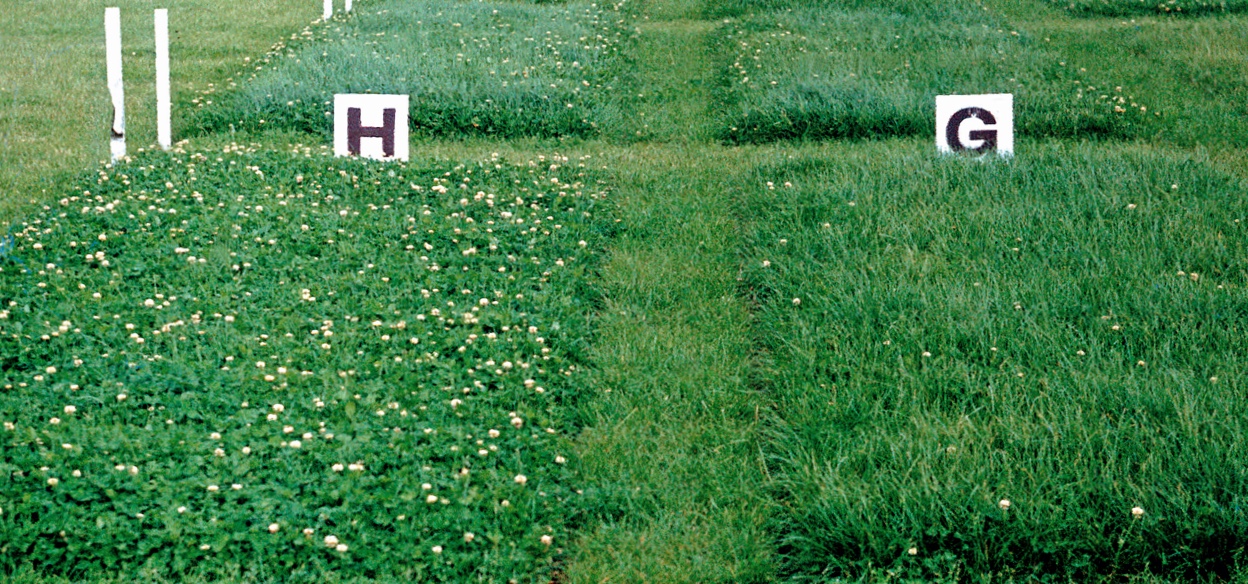
Visual differences
No visual differences were apparent in the first year at any of the cuts. In the second year (yields were 30% higher for the K1 and K2 plots) some slight differences were detectable because the crops were in adjacent plots. However, in a field situation and without the comparative treatments alongside, it is unlikely that the lower yielding K0 treatment would have aroused concern. For the last 2 years the nil potash plot was clearly evident with patchy irregular growth with yellowing of leaf tips and early death of older leaves particularly in the dry conditions of those years.
Yields
The actual yields varied each season according to the different growing conditions (mainly summer moisture). The yields are expressed relative to the K0 plot yield i.e.(K0=100 each year).
| Relative yields | 1987 | 1988 | 1989 | 1990 |
| K0 | 100 | 100 | 100 | 100 |
| K1 | 112 | 132 | 149 | 187 |
| K2 | 115 | 136 | 195 | 211 |
On this K index 1 site, yield response to potash in the first year was 12-15%. As the K level in the soil was reduced each year in the K0 plots where no potash was applied, the response to potash fertiliser on the K1 and K2 plots increased. By the fourth year the 320 kg/ha of potash applied to the K2 plot more that doubled the grass yield.
Soil analysis
Large quantities of potash are removed in silage and after 3 cuts in the first year, levels of available soil K were reduced on all plots with the greatest reduction where least potash fertiliser was applied. Whilst visually there were no problems at this stage the potential problem of lower yield had already been created. The K0 plot receiving no potash remained at seriously deficient levels. Although yields were highest on the K2 plot, the 320 kg/ha of potash applied each year appeared to be sufficient to maintain, or even slightly improve, soil fertility over the 4 years. The 160 kg K20/ha applied to the K1 plot did not fully maintain the initial level of soil K even though yield and K offtake was lower than that for K2.
| SOIL K mg/l (index) |
START | 1987 | 1988 | 1989 | 1990 |
| K0 | 93(1) | 37(0) | 35(0) | 29(0) | 35(0) |
| K1 | 93(1) | 40(0) | 59(0) | 65(1) | 77(1) |
| K2 | 93(1) | 60(1) | 88(1) | 98(1) | 113(1) |
Magnesium in herbage
The higher potash applications were associated with some reduction in magnesium content of the grass as has been observed elsewhere. However, the natural variations in magnesium content in different years were as great as the changes associated with potash manuring. Thus Mg levels cannot be ensured by not using potash fertiliser and in view of the large yield penalties resulting from under-use of potash this would be a very uneconomic approach.
| % Mg in first cut herbage | |||
| K0 | K1 | K2 | |
| 1987 | 0.20 | 0.19 | 0.18 |
| 1988 | 0.19 | 0.18 | 0.14 |
| 1989 | 0.16 | 0.17 | 0.13 |
| 1990 | 0.20 | 0.17 | 0.15 |
Potassium in herbage
The potash limitation to yield was reflected in the %K content of the herbage. At the start of the study the K content of the first cut grass was around 3.5% for all plots. By second cut in the first season the poorer K supply in the K0 plot resulted in a marked drop in leaf K content which continued for all subsequent cuts in following years. The fluctuation of K content in the other two plots is typical of herbage samples but it is possible to conclude that in this study satisfactory yields were associated with a herbage K content of between 2.0-3.5%. These levels were not indicative of any luxury uptake.

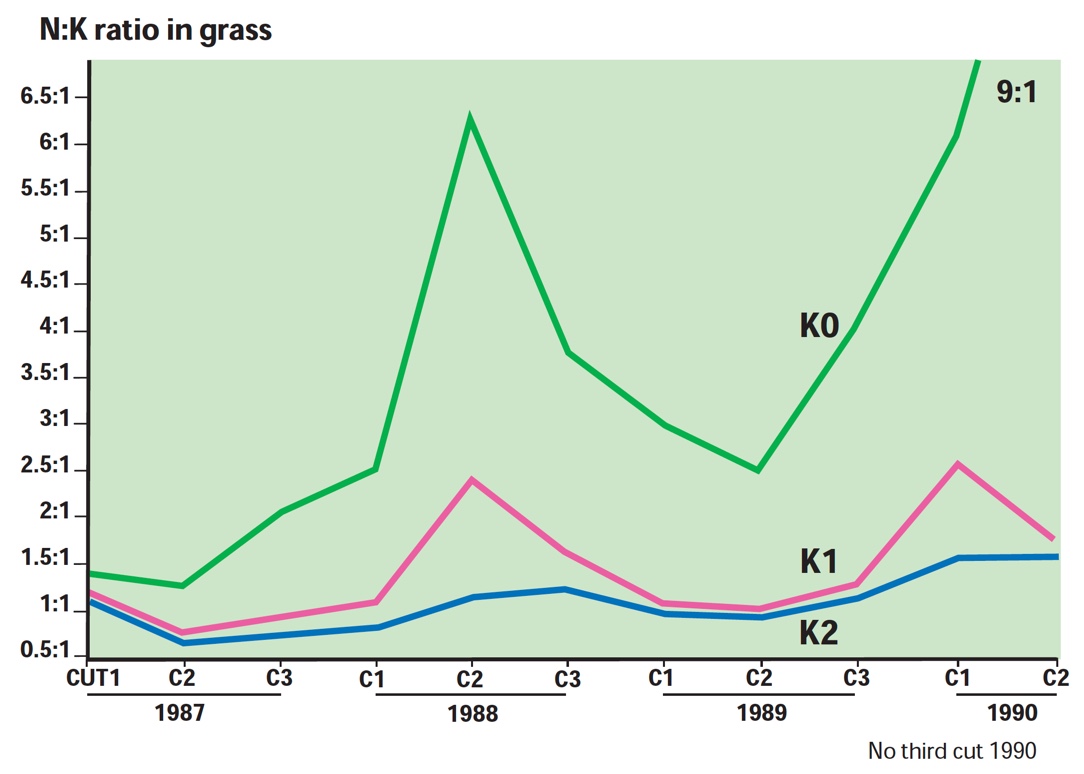
N:K ratio in herbage
Other studies have indicated that N:K ratio is a more reliable measure for advisory purposes than %K content. In these comparisons, the herbage from the K2 plot which gave the highest yields had a ratio consistently around 1:1.
The very poor yields of the K0 plot were associated with an N:K ratio of 1.5:1 and greater. With this nutrient imbalance, the utilisation of nitrogen was much reduced (the same level of fertiliser N was applied to all plots) and the risk of loss of nitrogen to the environment was therefore increased.
Potash removal
The large quantities of potash removed with silage were well illustrated by these crops. Over the four seasons, the K2 plot produced around 250 t/ha of grass which removed a total of over 1250 kg/ha of potash.
Conclusions
Large quantities of potash are removed where silage is taken. Over 320 kg K20/ha per year was needed in this comparison to maintain soil K reserves.
At soil K index 1 responses to fertiliser potash are well worthwhile. If soil fertility is allowed to fall, responses increase and in the fourth year of this work, yields of grass were doubled by potash application.
Where potash supply is limiting, nitrogen response will be impaired with increased risk of N loss to the environment.
A ratio of 1:1 for N:K in herbage was associated with the highest yields. The quantities of nitrogen and potash removed in silage are therefore similar and need to be replaced in similar proportions depending upon soil K contribution.
Potash recommendations for grass and silage are detailed in PDA leaflet 6 and PDA leaflet 14.