14. Potash for grassland for silage and grazing (4.09M)
pdf 4.09M
14. Potash for grassland for silage and grazing
Published June 2020
Importance of Potash
Many farmers are not getting the best from their grassland because of a lack of potash. Around 40% of grassland soil samples have below target K levels making them very responsive to added potash. Average applications of potash fertilisers to grassland have fallen by approximately 50% over the last two decades. This can result in costly penalties from under application through reduced yield and quality.
Part of the problem is that any under application may not be evident through deficiency symptoms or identifiable poor growth. Whilst Precision Farming techniques now provide arable farmers with increasingly sophisticated soil information for every part of every field, most grass farmers may be unaware of large differences in PK fertility within the same field. Zonal or hectare grid sampling for PK analysis can be a worthwhile check for grassland.
Whole farm forage yields and Dry Matter % are known with increasing precision, but assessment of individual field performance is often lacking though yields are not difficult to estimate, e.g. by counting bales or silage loads removed from the field.
Quantifying grass yield is of vital importance for both phosphate and potash because manure and fertiliser use need to be adjusted according to offtake in the grass.
A lack of yield measurement/estimation can also lead to inefficient manure use. There is frequently enormous scope to improve the effectiveness of manures, resulting in very valuable yield improvements or fertiliser cost savings.
New varieties and grass mixtures are constantly improving forage potential but this is not being realised in practice where potash supply is inadequate. This Cinderella input is regularly the limiting factor to grass performance.
The objective of this leaflet is to improve understanding of potash and provide recommendations to ensure more cost-effective usage which will result in better forage performance and lower unit costs of production.
Why potash is important
Potash is essential for grass yield and high-quality feed value.
Potash is used to regulate the movement and storage of solutes throughout the plant, comparable to the blood system in animals or humans. This is clearly a very wide ranging and vital role, affecting nutrient uptake, photosynthesis, rate of growth and feed value of forage. These functions require larger amounts of total potash in the plant than any other nutrient including nitrogen. If adequate amounts are not present grass will not grow or yield as it should.
A strong relationship exists between nitrogen and potash in plants. The large and worthwhile growth response of grass to nitrogen is dependent upon a balanced supply of potash both to assist nitrogen uptake by the roots as nitrate, as well as supporting the conversion of this into complex proteins needed by animals. Potash is also very important in the microbiological fixation of nitrogen by root nodules in legumes. If clover is required to play a significant part in the sward, the supply of potash is of even greater importance.
The practical implications of potash shortages are summarised in the following table:
| Deficient K | Satisfactory K |
| Lower yield | Full yield |
| Deterioration of sward composition | Maintenance of productive species |
| Less response to applied nitrogen | Maximum response to applied nitrogen |
| Increased risk of nitrogen loss | Minimal nitrogen loss |
| Less vigorous legume growth | Full potential legume contribution |
| Reduced nitrogen fixation by clover | Optimal nitrogen fixation by legumes |
| Risk of poor silage fermentation | Normal fermentation |
| Reduced protein production | Full protein production |
| Ranker, weak growth | Strong healthy growth |
| Greater susceptibility to frost | Less winter damage |
| Slower growth in spring | Earlier spring growth |
| Open swards, more sod pulling | Denser vigorous sward |
| Increased susceptibility to drought | Normal drought resistance |
| Increased disease susceptibility | Disease risk according to season |
| Poor recovery, especially in dry conditions | Quicker aftermath growth |
N:K partnership
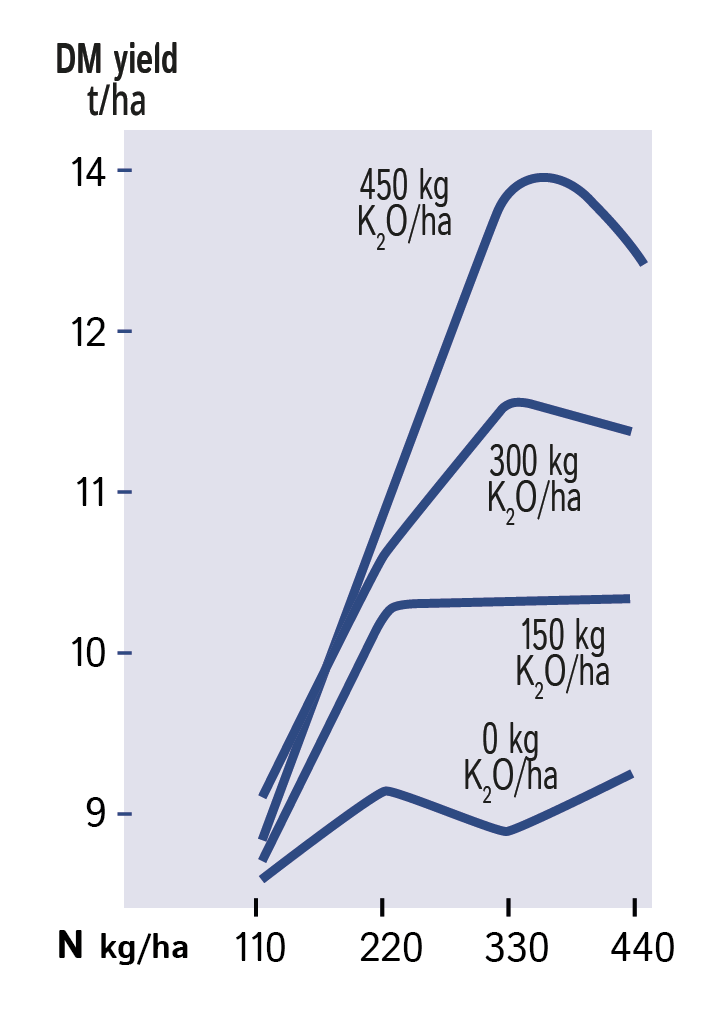
Grass requires a balance of nitrogen and potash to obtain full response to applied nitrogen.
Careful optimisation of nitrogen is a waste of time if potash supplies are not adequate. As shown in Figure 1, both the level of yield and shape of response curve are radically altered by potash limitation. Application of potash alongside optimal nitrogen increased annual yield from 9 to 14 t/ha.
If potash supply is limiting, the uptake and utilisation of nitrogen will be restricted. If soluble forms of nitrogen remain in the soil and are not taken up there is increased risk of leaching giving environmental concern when through-drainage occurs. Ready availability of both nutrients helps the uptake of the large requirements of nitrogen and potassium necessary for full yield. During rapid vegetative growth, the large uptake of nitrogen as negatively charged nitrate ions (NO3–) is normally balanced by a similar uptake of positively charged potash ions (K+) which maintains the electrical neutrality of the plant.
| Silage yield at 325 kg N/ha | ||||
| No Potash | 150 kg K2O/ha |
300 kg K2O/ha |
450 kg K2O/ha |
|
| Silage at 25% DM |
34 t/ha |
42 t/ha |
47 t/ha |
55 t/ha |
Potash and protein production
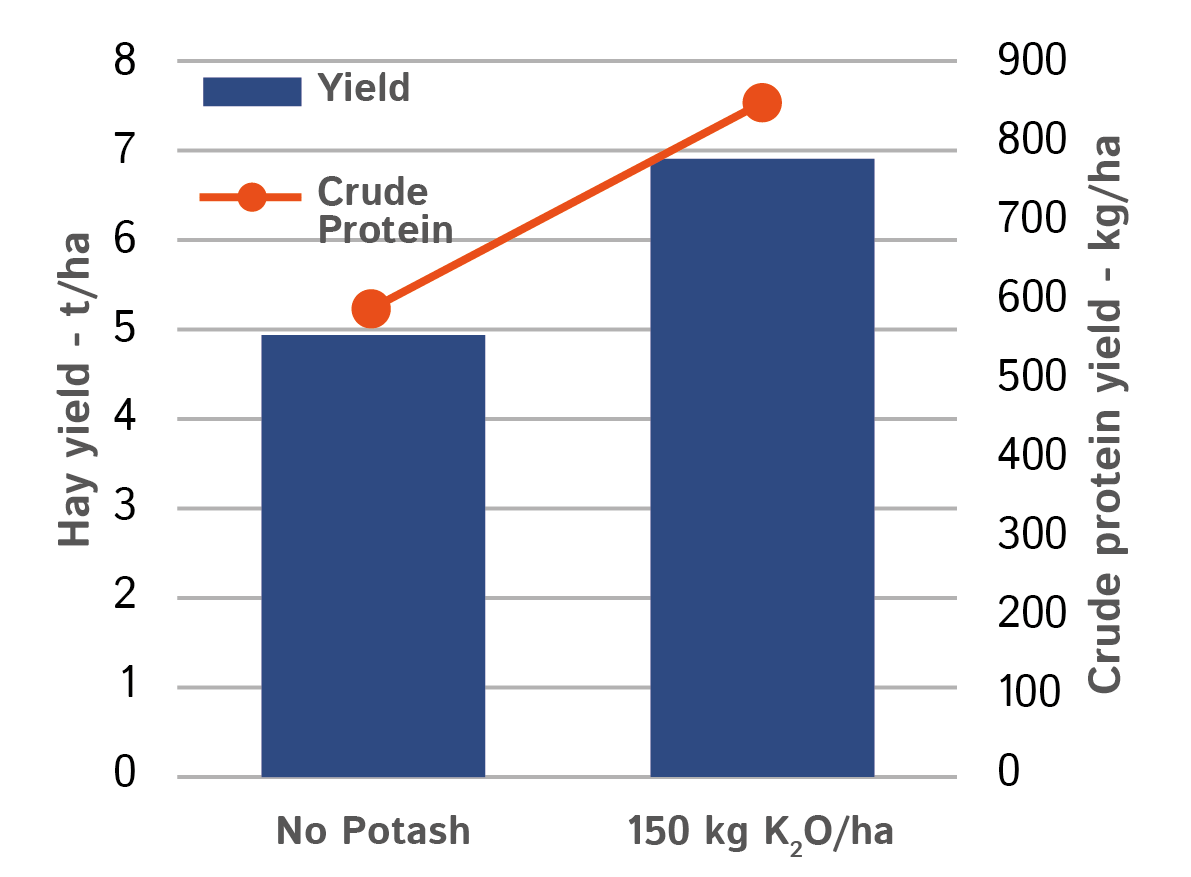
Potash is also important to achieve good feed value, as it affects the conversion of nitrate to protein. Total protein yield will be significantly reduced if potash is limiting.
Figure 2 shows the increase in both the hay yield and the % crude protein resulting from the application of potash, with the total protein yield rising by almost 45%.
Deficiency symptoms
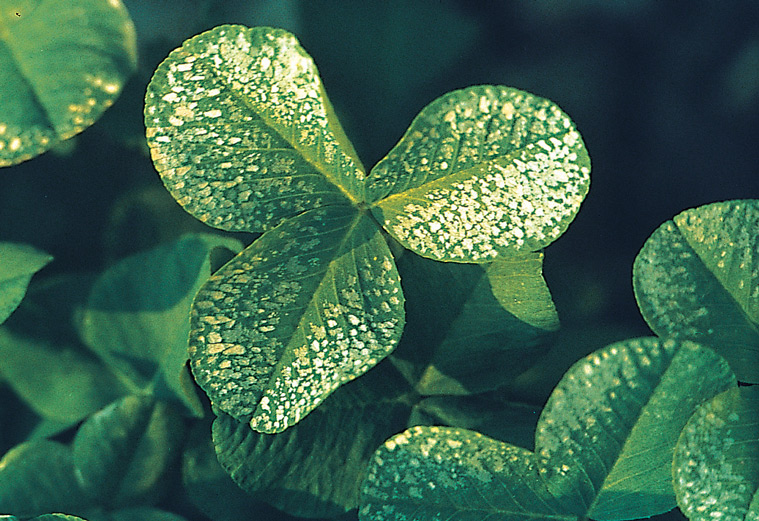
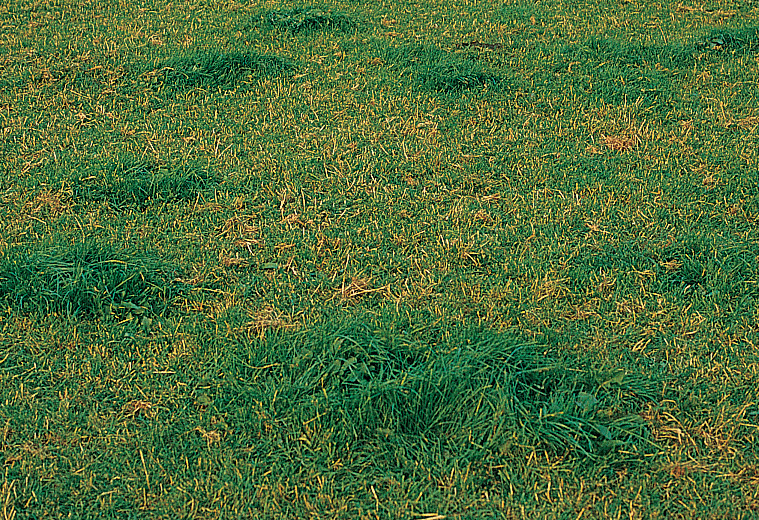
Potash deficiency is not easily identified in grassland. This is sometimes referred to as ‘hidden hunger’ because losses occur despite any recognisable visual symptoms. Typical deficiency symptoms in grasses are yellowing and chlorosis of the edge and tip of older leaves, with progressive senescence. Similar symptoms result from a number of other causes such as – drought, water-logging, wind damage, etc. Clovers become less vigorous with chlorotic speckles over the whole of the leaves which are frequently smaller than normal. After grazing, vigorous and darker regrowth in dung and urine patches is in contrast to yellower, poorer growth when potash is deficient – however, this can also reflect nitrogen supply.
In practice visual diagnosis is an unreliable means of detecting potassium shortage and regular soil analysis should be used to determine potash status.
Potash Supply
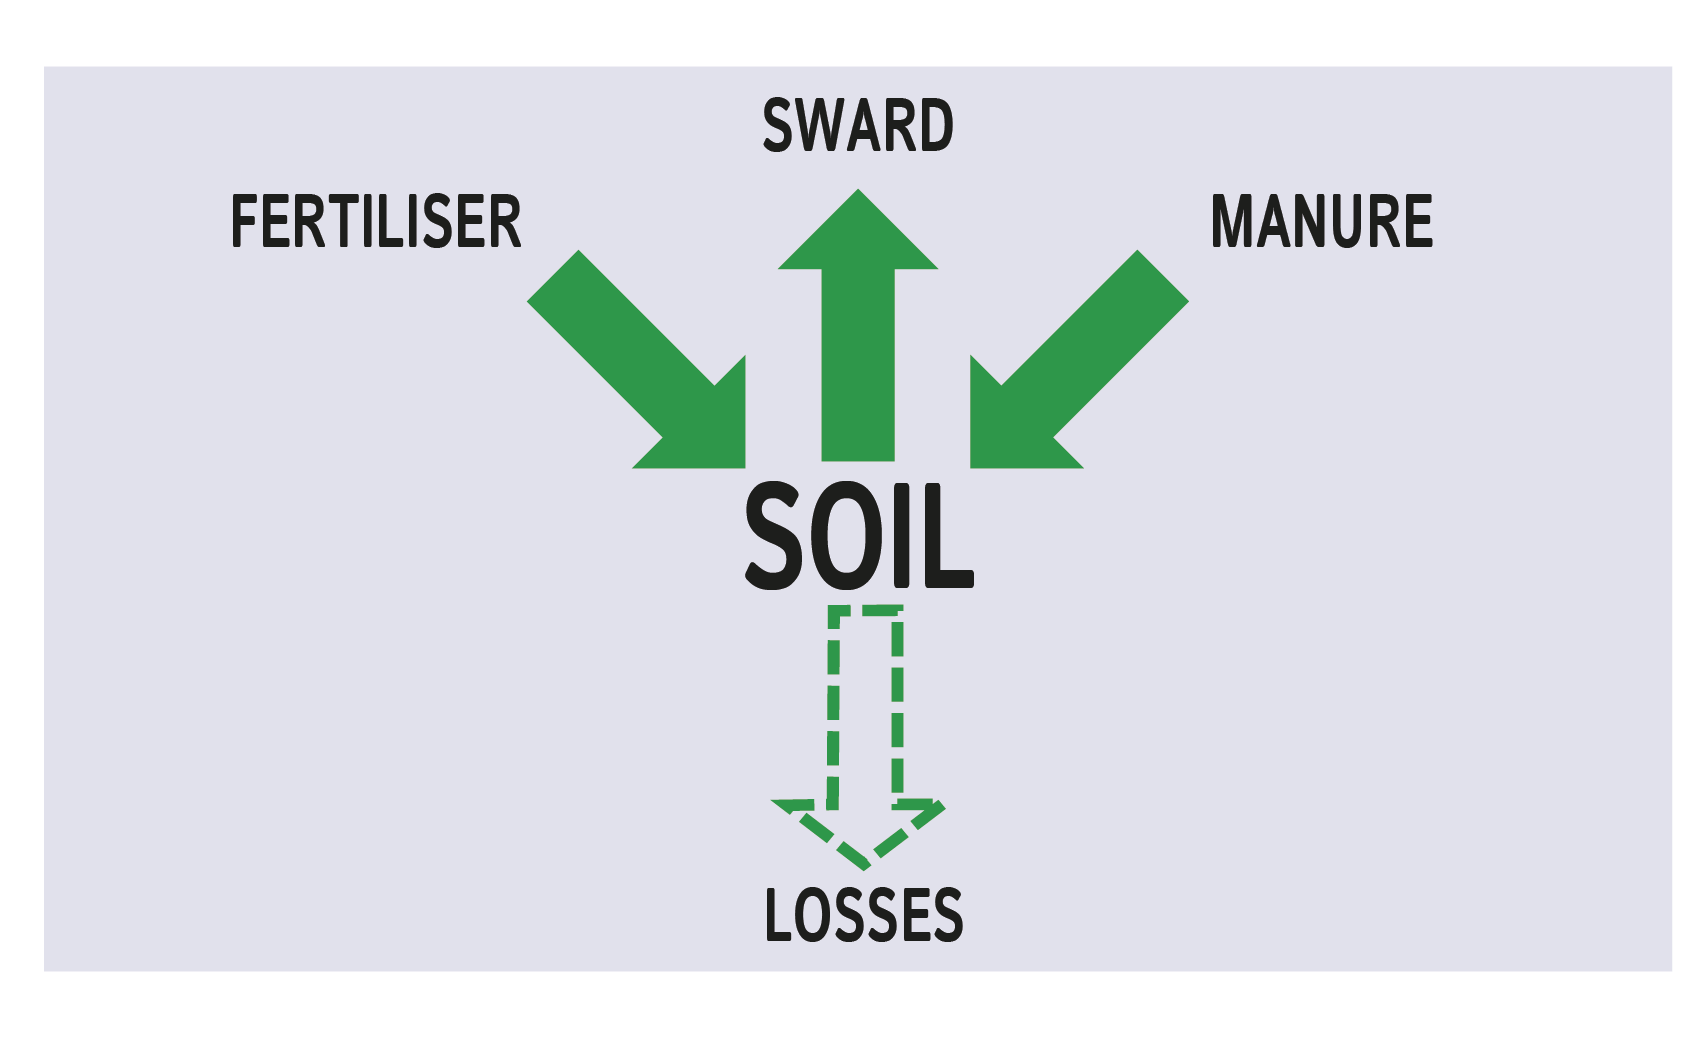
Grass takes up potash from soil reserves which should be replenished by additions of manures and/or fertiliser.
It is inefficient to allow soil reserves to fall to levels where grass growth is directly dependent upon fresh fertiliser applications.
The quantities of potash removed in silage are large and, for multi-cut systems, greater than most arable crops. Clearly it is important to replace these nutrients and logical to return manures onto fields growing silage, hay or wholecrop cereals. In practice, this may not occur because cutting fields are more remote or less convenient. It’s common to find fields which regularly grow maize with high applications of manure that have excess soil P and K whilst grass silage fields do not receive manure and have deficient nutrient levels.
The situation is very different with grazing. Because around 90% of the potash in grazed grass is returned directly to the sward, the need for potash application is low. The return, however, may not be even and fertility can build up where animals congregate to drink, feed or lie, which means a run-down in other areas where they only graze. Common sense is needed when soil sampling to identify such differences, avoiding atypical areas.
Temporary grass leys should be soil sampled to 15 cm depth, permanent grassland to 7.5 cm.
Losses
Potash is not lost directly to the atmosphere and losses by leaching are generally small. Furthermore, potash leaching has no known adverse environmental effects.
It has been shown that most soils lose only about 1 kg/ha of potash for every 40 mm of excess rainfall. Losses by leaching for lowland grass production are normally less than 15 kg K2O/ha annually. Losses are particularly low when there is a good balance between the supply of K and N and where grass yields are high.
However, it is important to recognise that significant potash losses may occur via drainage or by run-off on shallow sandy soils and when fertiliser and particularly manures are applied under inappropriate conditions. Losses are greatest when,
- large quantities are applied to:
- very dry, deeply fissured soils
- waterlogged land
- frozen land which rapidly thaws;
- heavy rain occurs within four days of application, particularly in autumn and winter.
Potash losses may amount to half the amount applied under such conditions. This is a serious financial loss and the associated phosphate loss may provide an environmental hazard.
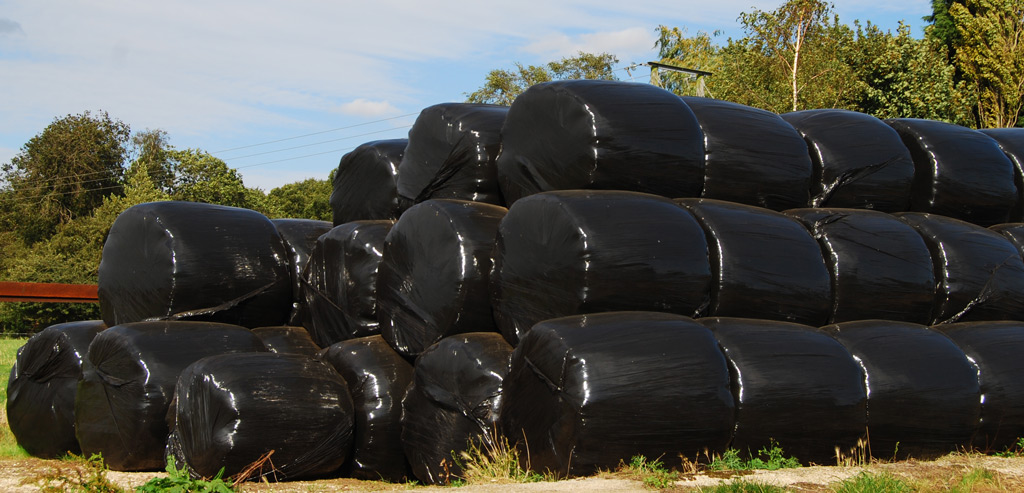
Losses also occur from manure heaps and in silage effluent, with up to 50% of available potash at risk in uncovered stores. Potash is normally freely soluble and most loss occurs in the liquid fraction of animal wastes, crop effluent, etc.
Principles of nutrient management
“Let the soil feed the crop, use fertiliser and manures to feed the soil”
Potash reserves in the soil are more effective at supplying the plant than fresh fertiliser applications. Impoverished soils often do not produce the same yields as fertile soils even if higher fertiliser rates are applied (Figure 3).
An adequate reserve of phosphate and potash to feed the crop should be maintained in the soil by using fertilisers and manures to replace what is removed by cutting or grazing. For soils with low reserves, extra fertiliser should be used to restore fertility to target levels. For soils with high reserves, fertiliser usage should be reduced or omitted.
| Target soil fertility | Soil P Index | Soil K Index |
| Sand & peat soils | 2 | 1+ |
| All other soils | 2 | 2- |
Soil analysis
Knowledge of the fertility level in the soil is essential to determine fertiliser policy.
It is impossible and irresponsible to guess correct fertiliser use without soil analysis which should be re-taken within 4 years on conserved grassland and within 5 year on grazed only land. Soil analysis provides a measure of nutrient available to the crop – the total level of potash (and phosphate) in any soil is very much larger but is not relevant to plant use. The physical condition of a soil is also of vital importance e.g. structure, depth of soil, level of organic matter and stone content. These must be considered first before interpreting soil analysis (see PDA leaflet 24 Soil Analysis, Key to Nutrient Management Planning).
Because soil fertility varies within fields and according to soil conditions and climate, soil analysis is not a precise measurement and the index system has therefore been developed to indicate the general pattern of crop response to added nutrient. Soil K index 2 is divided into a lower and an upper half denoted by minus and plus signs.
| Soil P Index | mg P/l | Yield response to applied nutrient | Soil K Index | mg K/l |
| 0 | 0-9 | Large response likely | 0 | 0-60 |
| 1 | 10-15 | Response likely | 1 | 61-120 |
| 2 | 16-25 | Response to timely application Response less likely |
2- 2+ |
121-180 181-240 |
| 3 | 26-45 | No response, good reserves* | 3 | 241-400 |
| 4 | 46-70 | Unnecessarily high reserves | 4 | 401-600 |
| * on cut systems some potash is advised to regulate run-down of soil K | ||||
For grassland soils sampled in 2018/19, 8% had a K index 0 and 33% had an index 1. For phosphate it was 13% and 22% respectively.
Herbage analysis
Herbage analysis can be used as an adjunct to soil analysis or as an extra diagnostic tool in specific circumstances.
The maintenance of an adequate level of soil K can be achieved at low cost and will normally ensure that crop needs are being met without the need for tissue sampling and analysis. Where tissue testing is used, tissue water (cell sap) measurement is recommended. This indicates whether K concentrations are at or below optimum levels and is more reliable and meaningful than measurement of K content in the dry matter. %K in dry matter varies widely with season, stage of growth, part of plant, fertiliser (N or K) application and weather or other factors which affect nutrient uptake and rate of growth. Where dry matter analysis is used, 1.8-3.0% K normally represents a satisfactory level, but a better measure is the N:K ratio in herbage which should be between 0.9:1 and 1.1:1.
Over-high application rates
When more K is provided than is necessary, grass may continue to take up K with no change in yield, so that % K content in the plant increases. This should be avoided on cost grounds, but may also reduce magnesium availability and increase the risk of hypomagnesaemia (staggers) although the more frequent reason for such mineral disorders is that total dietary magnesium supply fails to meet the demand of the animal.
Animal stress such as calving or lambing increases the risk of mineral imbalance in the animal. Adverse weather conditions provide a double risk in that stress on animals is increased and growth rate and nutritional content of herbage is reduced. Magnesium problems are more likely on sandy and chalky soils and in other situations where soil Mg is poor. Maintenance of soil Mg at index 2 by the use of magnesium lime or fertilisers is advised where there is a history of problems.
Potash requirements for grazing are low as detailed above but it is obviously prudent to avoid any potash applications, including FYM or slurry, at times of greatest risk of mineral imbalance, such as during the spring flush of growth and in the autumn when grass supply and value is decreasing. There are no risks of upsetting magnesium balance in silage if proper calculation of potash need is undertaken based on soil analysis and crop removal. It is essential to include the contribution of manures in the calculation. If magnesium intake from forage is low, animal requirements should be achieved by supplementary provision.
For cut swards there is a much greater risk that potash supply will be insufficient for full yield than of over-high application.
This topic is dealt with in more detail in PDA leaflet 6 Potash, Magnesium and Sodium Fertilisers for Grass and Technical Note: Fertilisers and Hypomagnesaemia: An Historic Exaggeration?
Phosphate & potash removal
Phosphate and potash use should be based on the amounts removed.
These can be estimated using typical rates of phosphate and potash removal in each tonne of different grass crops, as follows:-
| Crop | Removal / tonne | |
| kg P2O5 | kg K2O | |
| Fresh grass 15-20% DM | 1.4 | 4.8 |
| Silage 25% DM | 1.7 | 6.0 |
| Silage 30% DM | 2.1 | 7.2 |
| Haylage 45% DM | 3.2 | 10.5 |
| Hay 85% DM | 5.9 | 18.0 |
Typical whole season removal per hectare for different systems, assuming average yields:
| Crop | Cumulative yield | Removal per ha | |
| t/ha | kg P2O5 | kg K2O | |
| 1 silage cut | 23 | 40 | 140 |
| 2 silage cut | 38 | 65 | 230 |
| 3 silage cut | 47 | 80 | 280 |
| 4 silage cut | 54 | 90 | 320 |
| 1 hay cut | 5 | 30 | 90 |
If the silage is 30% Dry Matter offtakes are increased by 20% compared to above.
With very high herbage yields, the annual potash removal may reach 500 kg K2O/ha.
Aftermath grazing results in negligible additional removal of extra P or K.
PK balance
Silage, hay and maize remove 3 to 3.5 times as much potash as phosphate.
This K:P ratio is wider than in most PK fertilisers whose use has resulted in over-application of phosphate and under-application of potash leading to excess soil P, which is undesirable for environmental reasons, and to low soil K which will reduce yields.
Sulphur
Sulphur in the soil acts in a similar way to nitrogen. It is released from the breakdown of organic matter, and to some extent from soil minerals. Soils which are organic, or heavy textured are more able to supply adequate sulphur than light and inorganic soils.
The organic sulphur compounds from applied organic materials and from excreta deposited while grazing, are broken down to inorganic forms, which are then useful to the plant. These sulphate ions reside in the soil solution which means they are liable to be leached, depending on the soil texture and rainfall, just like nitrate. This risk must be taken into account when nutrient planning.
The major role of sulphur in all plants is in support of nitrogen in protein production which is hugely important for high crop yields. However, sulphur is probably more important for improving the nutritional quality of grazing and silage, in terms of true protein, than the yield increase achieved.
Deficiency symptoms show up in the younger leaves first as a pale-yellow appearance (chlorosis) and, later on, stunting. Symptoms are easily missed, or confused with nitrogen deficiency, and may not be noticed at all, especially in grass.
Upland and organic farming systems
The same principles of potash manuring apply to all systems of production and are even more important for systems which rely on clover to generate nitrogen by biological fixation as this is seriously affected by any shortage of potash. The intensity of stocking and conservation yields clearly affect the amount of potash removed and the ‘standard’ recommendations below should be adjusted accordingly.
Yields from grass-white clover swards without N fertiliser are normally some 80% of those from grass with high N application (as in example below). However, lucerne and red clover in organic systems will commonly give as high yields as grass, leading to very high removal of potash (and/or sulphur). Clover-based silage and lucerne may run short of sulphur also.
Example
In a system involving grazing + a single silage cut of 15 t/ha instead of the ‘standard’ 23 t/ha on a field at K index 1, the potash requirement should be calculated as follows:
The ‘standard’ potash recommendation is 170 kg/ha (made-up of 140 kg to replace removal in 23 t/ha silage cut + 30 kg to improve soil K).
Adjust removal amount for lower yield: 140 x 15/23 = 90 and add the + 30 kg to improve soil K = new recommendation of 120 kg/ha.
On an organic unit this would require 14 t/ha of cattle FYM to supply this amount of potash. If this quantity is not available the difference should be made up with a suitable potash fertiliser such as Polysulphate. (See PDA leaflet 23 Potash for Organic Growers).
It is important to ensure that potash removed in any system is replaced if soil fertility is to be maintained and a sustainable system operated.
Manures on farm simply re-cycle nutrients that were in the soil to start with, plus some nutrients from bought-in feeds. Even where manures are stored and used efficiently there will be some natural losses from the system as well as an ‘export’ of potash in whatever products are sold off the farm. Approved potash fertiliser or imported manures will be needed to replace these quantities and maintain soil fertility.
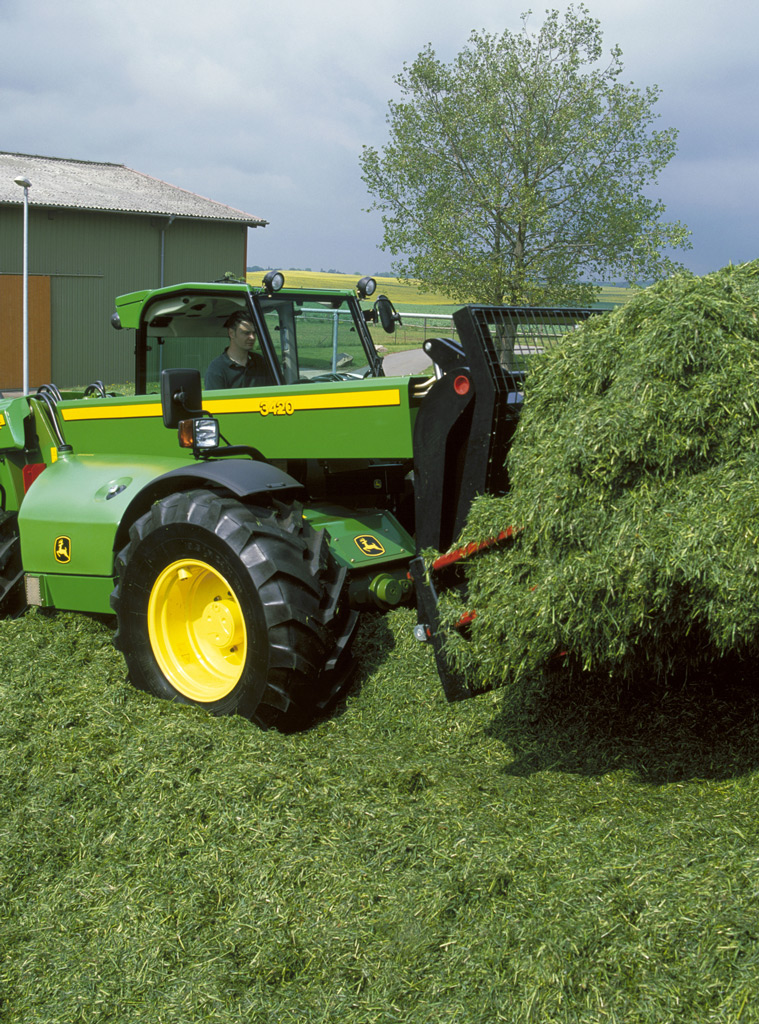
Manures
This is often the area of greatest scope to improve grassland nutrient management and reduce fertiliser costs.
Manures contain valuable levels of phosphate and potash; cattle slurry and FYM provide P and K in the ideal ratio required for grass for silage or hay. A manure management strategy should target the use of manures on crops and grass for conservation, rather than uncut grassland, which already receives adequate nutrient returns from grazing animals.
Manures also contain some sulphur, the availability of which will vary depending on the timing of application. Availability is 15% in autumn applications of livestock FYM when applied to grassland, increasing to 45% for spring applied slurry and 60% for poultry manures. These provide a contribution to crop need, but at typical application rates supply is insufficient and some sulphur fertiliser is still usually required.
Typical composition of manures from AHDB Nutrient Management Guide are given below. The availability within the first year after application is assumed 60% for phosphate and 90% for potash. There are, however, big variations in composition, particularly affected by the dry matter content of slurries, so that occasional analysis of the nutrient contents of manures should be carried out. It is clearly also important to ascertain manure application rates in order to calculate the quantity of nutrients applied.
| Fresh-weight basis | Total nutrients (soils > Index 1) |
Available nutrients (Index 0 or 1) |
Available SO3b | |||||
| Phosphate | Potash1 | Phosphate | Potasha | |||||
| FYM (kg/t) | ||||||||
| Cattle | 3.2 | 9.4 | 1.9 | 8.5 | 0.3 | (0.4) | ||
| Pig | 6.0 | 8.0 | 3.6 | 7.2 | 0.5 | (0.9) | ||
| Sheep | 3.2 | 8.0 | 1.9 | 7.2 | 0.6 | (0.6) | ||
| Poultry | ||||||||
| 20% DM | 8.0 | 8.5 | 4.8 | 7.7 | 0.5 | (1.8) | ||
| 40% DM | 12.0 | 15.0 | 7.2 | 14.0 | 0.6 | (3.4) | ||
| 60% DM | 17.0 | 21.0 | 10.2 | 19.0 | 0.9 | (4.9) | ||
| 80% DM | 21.0 | 27.0 | 12.6 | 24.0 | 1.1 | (6.6) | ||
| Slurry (kg/m3) | ||||||||
| Cattle (6% DM) | 1.2 | 2.5 | 0.6 | 2.3 | 0.1 | (0.3) | ||
| Pig (4% DM) | 1.5 | 2.2 | 0.8 | 2.0 | 0.1 | (0.3) | ||
| Strainer box (1.5% DM) | 0.3 | 1.5 | 0.15 | 1.4 | – | (0.1) | ||
| Weeping wall (3% DM) | 0.5 | 2.3 | 0.25 | 2.1 | – | (0.02) | ||
| Dirty Water (0.5% DM) | 0.1 | 1.0 | 0.05 | 1.0 | 0.02 | (0.05) | ||
| a Values will be lower for FYM stored for long periods, with up to 50% of available potash at risk in uncovered stores. | ||||||||
| b Autumn applied. Spring applied in brackets. | ||||||||
The following points are very important in relation to the effective use of manures:
- Slurry and poultry manures are best applied to land for silage or hay in late winter-early spring, close to the period of active grass growth and demand for nutrients, in order to reduce losses, particularly of nitrogen.
- Earlier application times are possible for solid FYM. Slurry may also be applied after cutting in spring and summer.
- Individual slurry applications should not exceed 50 m3/ha where there is risk of nutrient losses via surface run-off. In February the maximum is 30 m3/ha in NVZs.
- Run-off losses may be high if there is high rainfall within 3 to 4 days of application, particularly in early winter.
- Applications for first-cut silage should be made by the end of March to reduce risk of excess nitrogen in the silage at cutting.
- For subsequent cuts, slurry application should be made as soon as possible after the previous cut, ideally by band applicator.
- Manure application to land for grazing may reduce grass intake, cause nutrient imbalance and contribute to disease transfer. It is best to avoid slurry applications to grazing land in late winter/early spring. Pasture should not be grazed for one month, and preferably two months, after application or until all visible signs of slurry solids have disappeared.
Recommendations
The requirements for P and K to be supplied from fertilisers and organic manures are given below. The recommendations are calculated to achieve full yield and maintain, improve or reduce soil P and K according to the soil index.
Replacement values (M) are based on the average yields shown – if significantly different yields apply, the rates should be adjusted accordingly. Rates should also be adjusted if herbage analysis indicates N:K ratios outside the optimal values. The supply of nutrients from manures must be calculated and fertiliser then used to rectify any shortfall in supply.
| kg/ha total over season | Soil Index | ||||||
| 0 | 1 | 2- | 2+ | 3 | 4 | ||
| 1 | cut & graze (23 t/ha) | ||||||
| Phosphate | 100 | 70 | 40M | 20 | 4 | ||
| Potash | 200 | 170 | 140M | 120 | 30 | 0 | |
| Sulphur | 40 | ||||||
| 2 | cuts & graze (23+15 t/ha) | ||||||
| Phosphate | 125 | 95 | 65M | 20 | 0 | ||
| Potash | 320 | 270 | 230M | 180 | 70 | 0 | |
| Sulphur | 80 | ||||||
| 3 | cuts (23+15+9 t/ha) | ||||||
| Phosphate | 140 | 110 | 80M | 20 | 0 | ||
| Potash | 370 | 320 | 280M | 190 | 90 | 0 | |
| Sulphur | 120 | ||||||
| 4 | cuts (23+15+9+7 t/ha) | ||||||
| Phosphate | 150 | 120 | 90M | 20 | 0 | ||
| Potash | 410 | 390 | 350M | 230 | 110 | 0 | |
| Sulphur | 160 | ||||||
| 1 | cut hay & graze (5 t/ha) | ||||||
| Phosphate | 80 | 55 | 30M | 0 | 0 | ||
| Potash | 140 | 115 | 90M | 65 | 20 | 0 | |
| Sulphur | 40 | ||||||
| Grazed only | |||||||
| Phosphate | 80 | 50 | 20 | 0 | 0 | ||
| Potash | 60 | 30 | 0 | 0 | 0 | 0 | |
| Sulphur | 20-60 | ||||||
| Establishment (These rates should be deducted from first season’s requirements) | |||||||
| Phosphate | 120 | 80 | 50 | 30 | 0 | ||
| Potash | 120 | 80 | 60 | 40 | 0 | 0 | |
| PK fertiliser/manure plans are based on expected yields. If actual yields are very different, the over or under applied potash can be taken into consideration in the following year’s plan. | |||||||
Run Down
The table shown here, and in the AHDB Fertiliser Manual, implies fast run-down of potash at index 3 under multi-cut management. It recommends 190 kg K2O /ha less than maintenance for 3 cut silage. If fields are in continuous silage production, this is a net removal of 570 kg/ha over 3 years. Most medium to heavy soils have enough buffering, but in such cases it would be prudent to sample soils to the full 15 cm depth and retest every 3 years.
The potash requirements in the table are for the middle of each index range and for soils at the lower end of index 3 application rates should be intermediate to those at index 2+.
PDA P&K Nutrient Calculator
Using the values included in the table to build low soil index it may take at least 10 years to raise soil K from the bottom of index 1 to the bottom of index 2.
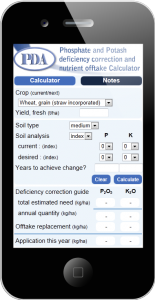
This can result in a long period of time where soils are below the target index, with yields suffering as a result. The PDA P&K Nutrient Calculator enables a quick calculation of the phosphate and potash offtakes and provides a guide to the quantity of nutrient required to correct any deficiencies, where soils are below the target index, within a specified number of years.
The calculator is available as an app on Apple and Android devices as well as online at the PDA website.
Timing
Phosphate
All fertiliser phosphate amounts should be applied early in the season for 1 or 2 cut systems and grazed-only grassland, especially if soil P reserves are low. For long term improvement less soluble forms of phosphate may be applied over winter.
Timing of phosphate applied in manures will largely depend upon practicalities of manure management and its effect on the efficiency of use of other nutrients, particularly nitrogen. Care must be taken to avoid manure run-off; this risk should be assessed before applications in wet conditions or when heavy rainfall is possible.
Potash
- No more than 90 kg K2O/ha should be applied for any one cut during the growing season. The balance of potash can be applied in the previous autumn/winter and to aftermath grazing at 30 kg/ha per grazing or during the next autumn. At index 2- or above all above all the balance may be applied following to the final cut.
- Experiments carried out by ADAS at 23 sites in England and Wales showed no differences in first cut yields between K applied in November-December compared with mid-February to mid-March, although K recovery in the grass was slightly lower with the earlier application time.
- Make allowance for potash in FYM/slurry applied by reducing the fertiliser application nearest to the time of application of the manures. For example, if manure is applied in mid-season, reduce the fertiliser potash rate to second cut silage or aftermath grazing.
- In multi-cut systems aim to apply some potash before growth of each cut. Rapid silage growth causes a temporary drop in soil available potassium so second and subsequent cuts may benefit from fresh potash applications even if the index is normally adequate.
- For grazing, do not apply potash during spring except as high N low PK fertilisers providing less than 15 kg K2O/ha per application.
Sulphur
With the reduction in atmospheric sulphur deposition, the majority of grassland is now at risk of sulphur deficiency. For silage crops, the recommendation of 40 kg SO3/ha should be applied prior to each cut. In grazing situations 20-30 kg SO3/ha should be applied at the same time as nitrogen when up to 100 kg N/ha is applied. An additional
20-30 kg SO3/ha should be applied for each additional 100 kg N/ha applied.
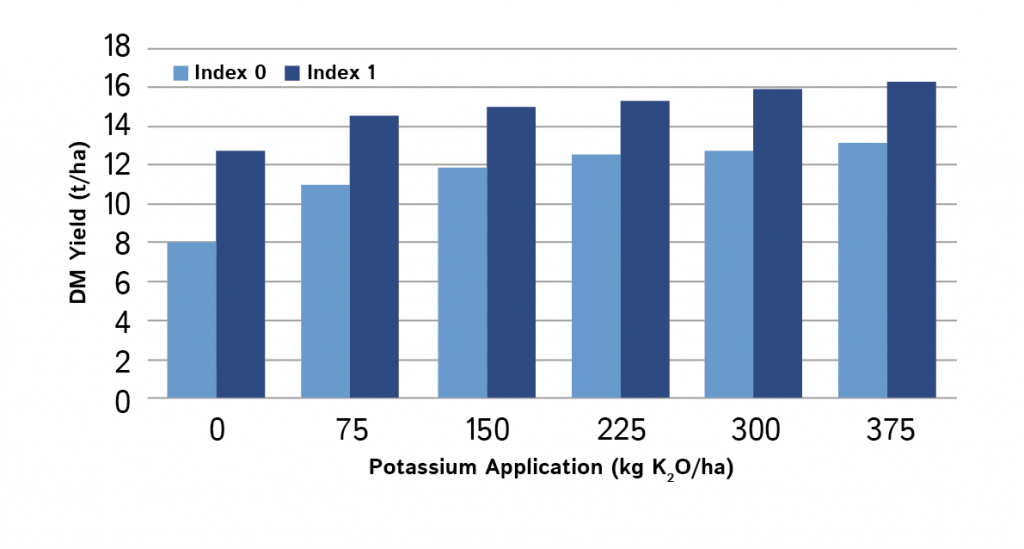
Economics of potash use on grass
Around 40% of all grassland soils analysed are at index 0 or 1, and for these, the justification for using potash has been shown in many trials as illustrated below. On the most deficient soils there may be a greater return from expenditure on potash than on nitrogen.
Index 0 soils
Trials have shown grass yield responses on K index 0 soils of between 37 and 65%, depending on the rate of potash applied (see Figure 5). With potash at £0.50/kg for example, the return on investment is £3-£10 per £1 spent on potash.
Index 1 soils
Figure 5 shows increases in grass yield of between 14 and 28% on K index 1 soils. The return on investment is £2-6 per £1 spent on potash.
Financial risks of cost saving
With livestock profits under severe pressure there is a great need to look for cost savings, but these need to be carefully targeted so that yield reductions do not outweigh any costs saved, for example by not applying potash.
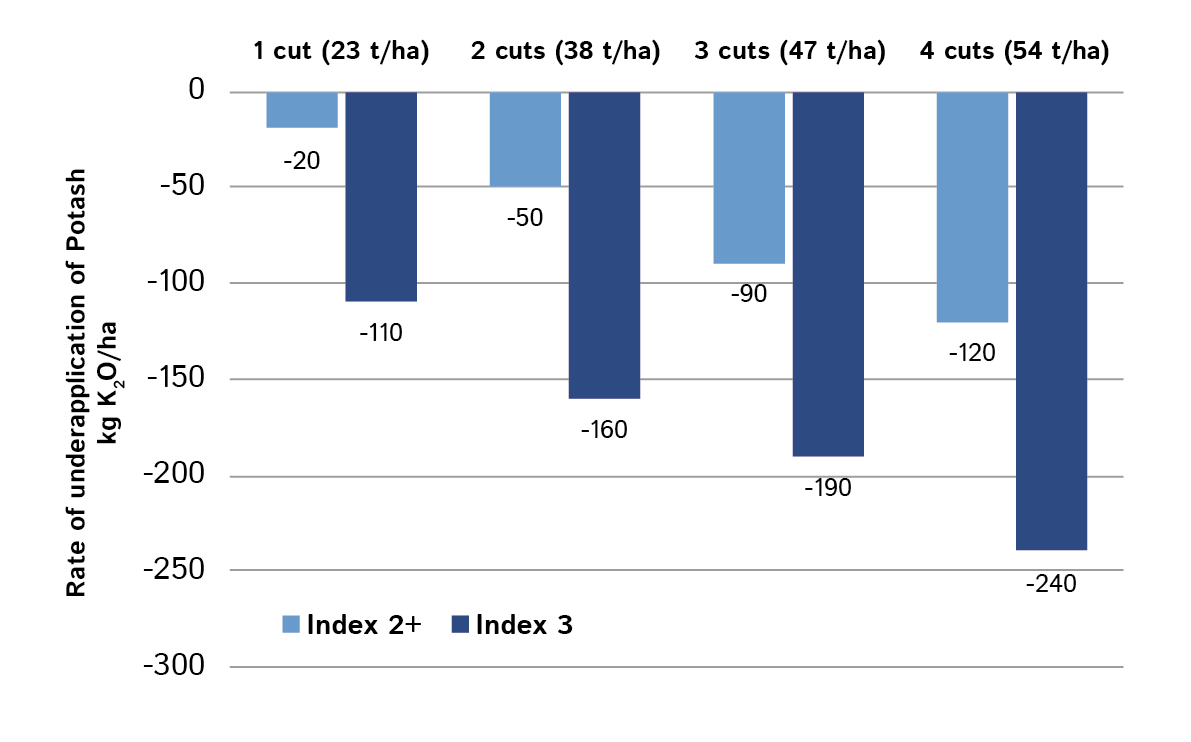
Nationally around 40% of grass soils are at K index 2 and are less likely to show direct response to applied potash (fertilisers or manures). For those at the higher range of this index band (index 2+) there are opportunities for some potash savings. However, if instead of the normal replacement policy at index 2-, no potash is used in order to save costs, soil reserves will fall at a rate related to the soil type and amount of potash removed each year. Medium and light textured soils under a two cut silage policy can be expected to fall from index 2- to index 1 in a single season if no fertiliser or manure is applied. Fertiliser use would then need to be raised to restore soil reserves and yields in the short term might still not match those where soil K had been maintained. PDA leaflet 5b Results from grass demonstration plots shows how quickly soil levels can fall in a multi cut situation.
If the same extreme cost saving approach was continued at index 1, yield penalties are severe.
Yield penalty if no potash applied on soil K index 1
| Year 1 | Year 2 | Year 3 | Year 4 |
| 13% | 25% | 49% | 53% |
| yield loss | yield loss | yield loss | yield loss |