
Download pdf: Soil sampling under different cultivation practices (1.44M)
pdf 1.44M
Soil sampling under different cultivation practices
December 2020
The premise for ensuring crops and grass have access to sufficient quantities of phosphorus and potassium to meet their uptake requirements over the course of a season is to assess the soil reserves. This is carried out in practice by taking a soil sample, either to 15cm depth in arable soils, or 7.5cm depth in permanent grassland. This is the well-established method of sampling for soils under different management. The greater depth measured in arable or temporary grassland reflects the cultivation depth considered most likely for such scenarios, whereas the shallower measurement depth in permanent pastures reflects the undisturbed nature of the soils. This does not suggest that soils do not contain any phosphate or potash at greater depths, however, these are the depths most likely to be influenced by management practices via fertiliser or manure applications and the ones that correlate to the well-established index and recommendation systems used across the United Kingdom. Response experiments with different crop groups have provided the relationship between crop yield and soil nutrient concentration. Normally, yields increase with increasing nutrient concentration to a maximum, beyond which there is no further benefit from additional nutrient. Below this value, which will vary with crop species, there is a yield penalty.
There are two aspects here to consider in more detail:
- Firstly, what happens to nutrients applied to soil that is not cultivated – as is the case of permanent pasture, but also increasingly in no-till systems?
- And secondly, how should soil sampling be carried out in min and no-till systems to give the most accurate measure of the concentration of nutrients in the soil?
Nutrient Stratification
Nutrient stratification refers to the accumulation of nutrients in differing concentrations down the soil profile. This can occur through applications of fertiliser and manure to the soil surface, or simply through crop growth, as plant roots scavenge deep into the soil profile for nutrients which then accumulate in plant material and senesce as the plant matures, leaving residues on or close to the soil surface, releasing nutrients back to the soil as they decompose.
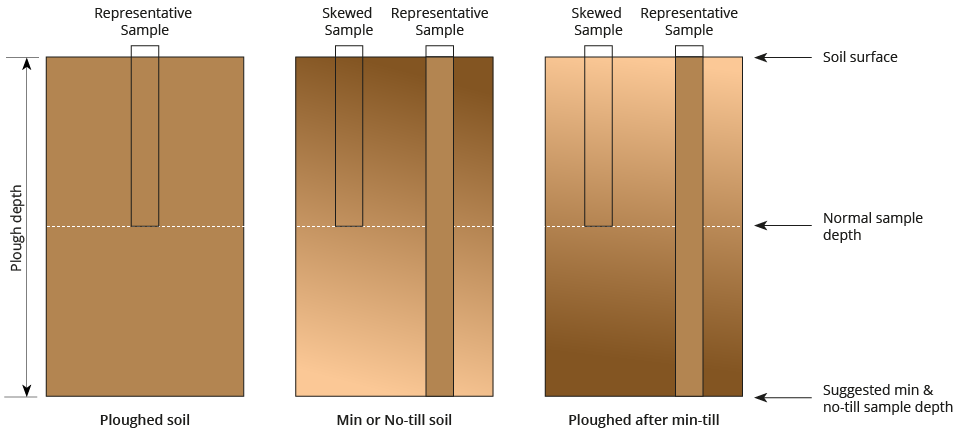
In ‘conventional’ tillage systems (systems that would have been prevalent when the index system and its related recommendations was first developed), nutrients applied to the surface would have been well mixed in the soil profile through cultivation, most likely ploughing. This would result in a fairly homogenous soil layer 20-25cm deep. As a result, a soil sample taken to 15cm depth would be representative of the full plough depth. The situation is quite different in soils that are not cultivated to such depths (min- till) or where there is no cultivation (permanent pasture and no-till).
In min-till soils, applied phosphate and potash will tend to accumulate in a shallow layer near the surface, leading to stratification of nutrient concentration in the top of the soil profile. Nutrient concentrations in a sample to 15 cm depth will not be equivalent to those in the traditional mixed layer, which is normally to the depth of ploughing. The samples will not be comparable and will tend to over-estimate the supply of phosphate and potash available to the crop.
In soils that are occasional ploughed after several years of minimum cultivation, the soil layer that is mixed by minimum cultivation (and relatively rich in nutrients) will be buried by ploughing to a depth that is not accessed during normal soil sampling. Samples taken after ploughing can underestimate the supply of phosphate and potash available to the crop in these systems.
With the adoption of no-till methods, nutrient stratification has the potential to become even more pronounced than in min-till soils. With no cultivation to mix nutrient rich soil down into the profile, the movement of applied phosphate and potash is reliant on soil water and biological activity. The latter can occur through plant root death and earthworm transport, which may be more significant in no-tilled soils as the lack of cultivation tends to increase worm populations and preserve deep earthworm channels from one year to the next.
Although stratification can occur in many situations, it is greatest in no-till soils, but is this a problem and how should it be accounted for when sampling?
To answer the first question, there is plenty of trial data that would suggest not necessarily. Results of several research studies have shown that despite higher levels of potassium stratification in no-till systems, this has not impacted potassium uptake, in some cases actually improving it.
Soil Sampling
The problem comes when trying to put together nutrient management plans due to the interpretation of soil analysis results. Soil analysis data are only as good as the sample taken. A sample normally comprises around 1 kg of soil which is taken to represent an entire area or field, which contains around 2,000 tonnes of soil per hectare to a plough depth of 20 cm (8 inches). It is therefore imperative to obtain as representative a sample as possible or the results will not reflect the nutrient status accurately.
The image below shows the potential for sample results to be skewed in min-till or no-till situations, as the standard sample depth does not reflect a representative concentration down the soil profile due to nutrient stratification. In these situations, a greater sample depth, potentially to 20+cm may be more advisable, to build a better picture of the nutrient concentration in the full volume of soil and to be able to compare more closely with previous sample results.
Rules of sampling
| 1 | Use a suitable tool (cone auger, screw auger, corer etc) which facilitates and encourages the taking of more rather than fewer cores, of a uniform size and down to the full depth of sampling |
| 2 | Use suitable tool and packaging that will not contaminate the sample. Galvanised sampling tools are unacceptable for trace element analysis |
| 3 | Clearly label samples, indicating whether from arable or grassland |
| 4 | Sample to a consistent depth. Normal depth is 15 cm (6 inches) for arable soils, 7.5 cm (3 inches) for grassland |
| 5 | Divide the field into areas which are as uniform as possible in soil type, past cropping, and manuring history and sample separately. Small areas of different soil e.g. wet, chalky, shallow, stony etc. should be excluded |
| 6 | Avoid headlands, gateways, trees, mole hills, dung/urine patches, water troughs, areas where lime or manure has been dumped, old hedgerows/middens/ponds or any other irregular feature |
| 7 | Discard stones and plant debris |
| 8 | Take at least 25 cores from each area to be sampled and put them together to form a single representative sample. The numbers of cores should not be restricted simply because the container is full! Thoroughly mix all cores and take a sub-sample from this for despatch to the laboratory – this must be done carefully |
| 9 | Ensure the sample represents the whole area. Sample on a W pattern over the field; for a regular shaped field this means 7 cores per leg of the “W” |
| 10 | In the case of grid sampling a minimum of 16 cores is needed at each sampling point to obtain a representative sample. These should be taken in a regular pattern about 1 metre apart around the grid point. Grid points should be evenly spaced over the field and should not be more than 50 metres apart if a true map is to be produced |
| 11 | Sample at the same point in the rotation, before the crop which is most demanding or responsive to P and K. In descending order of importance these are: horticultural crops, vegetables, roots, pulses, spring sown combinable crops, winter sown combinable crops. For pH it is preferable to sample 12 months before a sensitive crop such as sugar beet or barley |
| 12 | Repeat sampling at the same time of the year |
| 13 | Avoid sampling under extremes of soil conditions e.g. waterlogged or very dry soil |
| 14 | Do not sample within 8 weeks of fertilising, or within 12 weeks of manure or slurry application, for P, K and Mg analysis or sooner than 12 months after liming for pH analysis |
| 15 | Maintain records and use the analytical results to develop nutrient management plans |
| 16 | Where sampling to diagnose a crop problem take multi-cored samples (at least 16 cores per bulked sample) from areas of poor growth and separate samples from normal (good) areas. The relative values between good and poor will be more informative than the actual values of the problem area |
Conclusion
Soil sampling always has been the starting point for nutrient recommendations. Despite changes in cultivation practices over the years, since the index system was first developed, and the interest in cover cropping and greater focus on soil health, there is no getting away from the basics. When material is removed from a field, nutrients are removed, which will need to be replaced through manures or fertiliser. It is often commented that there are vast reserves of phosphate and potassium in soils, and although this statement is correct, it is the quantities in an available form that are of critical importance.
Soil analysis may not be a perfect tool, but it is the most effective and practical means of assessing soil fertility in respect of pH and plant-available P, K and Mg. Analytical data should be used in conjunction with other knowledge such as soil type, structure and crop offtake as the basis for deciding on fertiliser and manure use.