
Download pdf: Soil sampling and different methods of arable cultivation (1.37M)
pdf 1.37M
Soil sampling and different methods of arable cultivation
December 2016
Soil sampling for the routine measurement of P, K, Mg indices and pH is familiar to most advisers and farmers. The same well-proven method has been used for many years – 25 cores taken in a ‘W’ or grid pattern across the field to a depth of 15 cm in arable soils. The cores are then bulked before laboratory analysis to determine average field P, K and Mg concentrations.
The 15 cm sampling depth allows easy manual collection of cores and should give results that are representative of the cultivated and mixed soil layer, from which the crop extracts much of its nutrient supply. Traditionally, this is the plough layer, which is deeper than the soil sampling depth. Nutrient concentrations in the cores taken are designed to represent those in the plough layer, i.e. the total cultivated soil volume in which the nutrients are effectively evenly mixed.
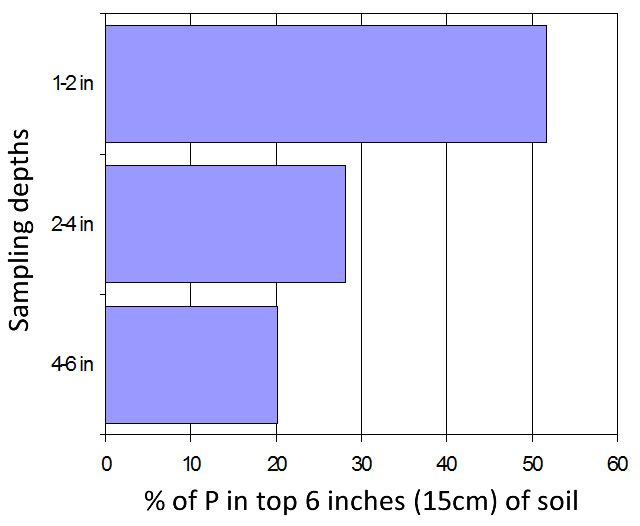
Things are rather different where minimum cultivation is practised. Here, the mixed layer of soil is much shallower than the sampling depth. The soil nutrients are likely to have become more stratified with relatively higher nutrient concentrations close to the soil surface. Analysis of the soil in a fertilised field in the USA after 10 years of ‘no-till’ showed for example that more than half of the extractable P (available P) in the top 6 inches (15 cm) of soil was actually in the top 2 inches (5 cm), as shown in Figure 1.
Effects of different cultivation systems:
Regular ploughing/cultivation:
Nutrients are mixed into a reasonably homogeneous soil layer 20-25 cm deep (depending on ploughing depth). Nutrient concentrations in a core taken to 15 cm should be the same as those in the whole mixed layer.
Regular minimum cultivation to 5 cm:
Applied phosphate and potash will tend to accumulate in this shallow mixed layer leading to stratification of nutrient concentration in the top of the soil profile. Nutrient concentrations in a sample to 15 cm depth will not be equivalent to those in the traditional mixed layer, which is normally to the depth of ploughing. The samples will not be comparable and will tend to over-estimate the supply of phosphate and potash available to the crop.
Occasional ploughing after several years of minimum cultivation:
The soil layer that is mixed by minimum cultivation (and relatively rich in nutrients) will be buried by ploughing to a depth that is not accessed during normal soil sampling. Samples taken after ploughing will tend to under-estimate the supply of phosphate and potash available to the crop.
One of the main reasons for taking soil samples for analysis is to see if any changes are taking place over time. If cultivation methods change, then usually soil samples taken by the standard method cannot be directly compared.
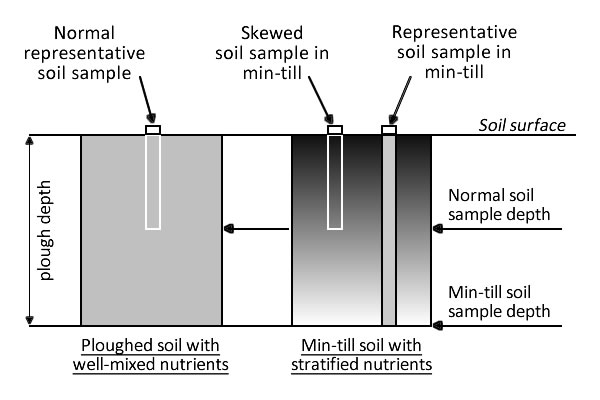
The standard method used on ploughed soils provides a value for the concentration in the soil to plough depth. Thus if some comparison is required between that sample and one taken subsequently after some years of minimum cultivation of the field, the new sample should be taken not to 15 cm but to the full original plough depth (Figure 2). This principle applies equally to field average sampling, and to point sampling for precision management.
In most arable systems, soil P and K concentrations only tend to change slowly, even where there are some increases or decreases in fertiliser application rates. Sudden changes in soil indices should always be treated with caution and an underlying cause sought. A change in soil cultivation method is a common cause and is usually easily identified.
There are some guidelines to help get the best from soil analytical data:
- Sample the soil at 3-5 year intervals so that trends can be seen. The cost of soil analysis is insignificant in relation to the importance of maintaining target P and K indices.
- It is essential to get a truly representative sample; follow the standard sampling protocol as in PDA leaflet: Soil Analysis or in RB (Appendix 3), except where a deeper sample is appropriate, as discussed above.
- Sample the soil in the same season each time, to help consistency. A large proportion of samples is taken from arable soils in summer/autumn but, even for autumn-sown crops, late spring may be a better time, when the soils will not be too dry. However do not sample within 3 months of an application, and preferably leave it longer. This is especially important where a post-planting PK application has been made, and there has been no opportunity for mixing it into the soil since then.
- Be prepared for a sudden change in measured soil indices when cultivation methods change.
- Always compare phosphate and potash inputs (fertilisers and organic manures) with the phosphate and potash offtakes in harvested crops, using yield data. This is often done over the period of the sampling interval to get the so-called nutrient balance. See PDA leaflet: Nutrients in Crop Material, and the PK Calculator.
- When interpreting changes in soil indices, compare them with these nutrient balances. This context usually explains the results and leads to better P and K planning.
The PK calculator on the PDA website is for checking crop removal values and also “build” values for a range of arable crops and grass, on different soil types.