
Download pdf: Soil sampling (1.63M)
pdf 1.63M
Soil sampling
September 2025
Soil provides a reservoir of nutrients required by crops and also therefore for animals but not necessarily at optimum levels for immediate availability to plants. The purpose of soil analysis is to assess the adequacy, surplus or deficiency of available nutrients for crop growth and to monitor change brought about by farming practices. This information is needed for optimum production, to avoid transferring undesirable levels of some nutrients into the environment and to ensure a suitable nutrient content in crop products. Farm assurance schemes, buyer’s protocols and codes of practice are increasingly demanding more accurate fertiliser recommendations which must depend on the nutrient-supplying capacity of the soil. Regular soil analysis, every 3-5 years, should be undertaken as a vital part of good management practice.
Introduction
The proportion of farmers undertaking some form of nutrient testing on soil has seen a steady increase in recent years. In 2025, 78% of farmers were regularly testing nutrient content (indices) of soil and 80% were regularly testing pH. Although this is a good proportion of farms, the reality is that since the introduction of the Farming rules for Water in 2018, all farms should now be carrying out regular soil testing.
The Sustainable Farming Incentive has helped to encourage the uptake of soil sampling, which is shown in the 2025 DEFRA Farm Practices survey results, with 29% suggesting they had used SFI funding to carry out testing. A further 66% of those said it was self-funded, 1% had funded the testing with another agri-environment scheme and the remainder funded in some other way. Of those that received funding, 54% said this had resulted in testing more frequently.
It’s not all positive news however, as the results of the latest Professional Agricultural Analysis Group (PAAG) analysis shows that although more sampling may be being carried out, a large proportion of the results from the sampling are still below the target, or optimum, level.
Furthermore, the Environment Agency audit process has identified a worryingly high level of farms still not carrying out soil sampling in the first place. In the last twelve months 36% of farms inspected failed due to a lack of valid soil testing. Whilst the farms selected for auditing were not random, with a larger number of livestock farms targeted, this is still a high proportion that do not have a soil sample, considering the requirement and the funding that has been available for this.
Fundamentals
As stated, the purpose of soil analysis is to assess the adequacy, surplus or deficiency of available nutrients for crop growth and to monitor change brought about by farming practices. However, this is not a straightforward process, with many variables, which can lead to challenges both taking and interpreting, the results.
Dry conditions
With one of the driest springs on record, followed by a dry summer, there has been much discussion surrounding the impact of dry soil conditions on sampling results. Whilst most areas of the UK have it was, it is worth looking at this to help interpret the results. Once samples are taken from the field and sent they are analysed. This drying process is standardised for all samples received, therefore this should eliminate any variances in soil moisture levels of the initial samples.
Issues with dry soil conditions at sampling can however occur surrounding the physical process of taking the samples in the field. Whilst it can be challenging to get to the appropriate depth when soils are dry. In arable situations in particular, fine loose topsoil can easily be lost from the auger whilst collecting the samples. This topsoil is likely to be higher in nutrient value than soil deeper in the profile, particularly under reduced cultivation practices, so losing this from the sample can lead to an artificially lower result than might otherwise be expected under higher soil moisture conditions.
pH impact on nutrient availability
The recommended target soil pH values for England, Wales and N Ireland and for Scotland are shown in the table below. pH values quoted from laboratories throughout the UK are numerically equivalent, even though the extractant is not always water. The recommended values in the table are therefore applicable wherever the soil has been analysed.
| England, Wales and N Ireland1 | Scotland2 | |||
|---|---|---|---|---|
| Optimum soil pH | ||||
| Mineral soils | Peaty soils | Mineral soils | Peaty soils |
|
| Continuous arable cropping | 6.5* | 5.8 | 6.0-6.2 | 5.7-5.9 |
| Continuous grassland | 6.0 | 5.3 | 6.0 | 5.3-5.5 |
| 1 For more detailed information see the Fertiliser Manual [RB209], Section 1. 2 For more detailed information see the SAC Technical Note TN656 * in arable rotations growing acid-sensitive crops such as sugar beet, barley etc. maintaining soil pH between 6.5 and 7.0 is justified. |
||||
Acidity below pH 6.0 will reduce the availability of some nutrients, especially phosphorus. Availability of trace elements is also radically affected by pH and the need for trace elements should be assessed only after any required correction of acidity has been undertaken and has had time to take effect.
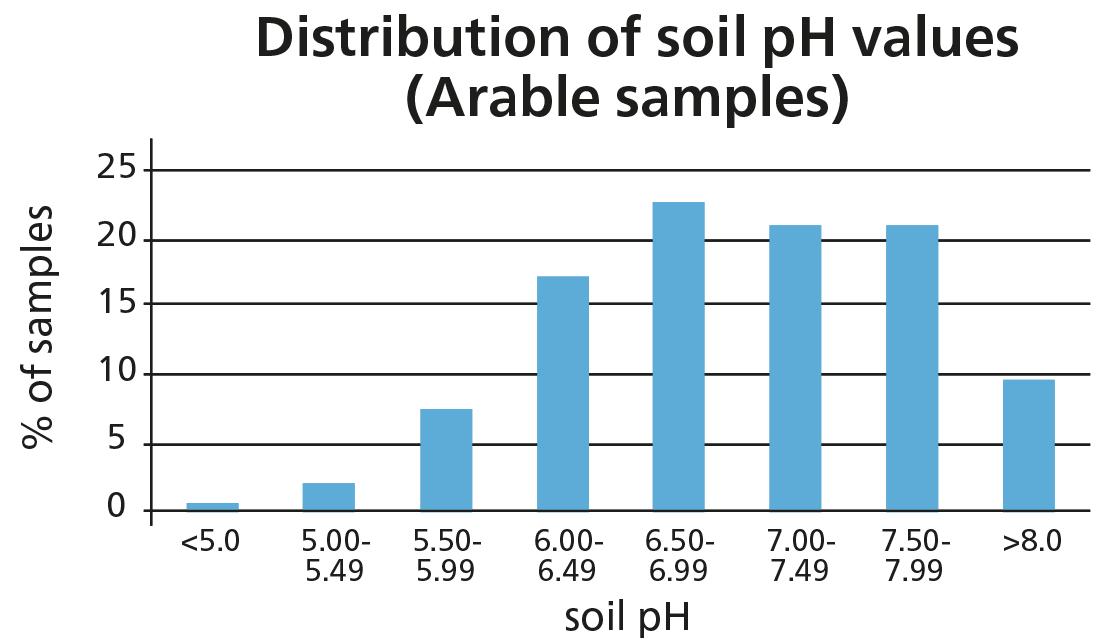
Unfortunately, the PAAG data suggests that not all soils are at the optimal pH levels, especially grassland soils. The charts opposite show that 26% of arable soils are below the bottom limit of pH 6.5, a further 22% are between 6.5 and 7, which means depending on the sampling interval, if not corrected may slip below the optimum before being corrected again.
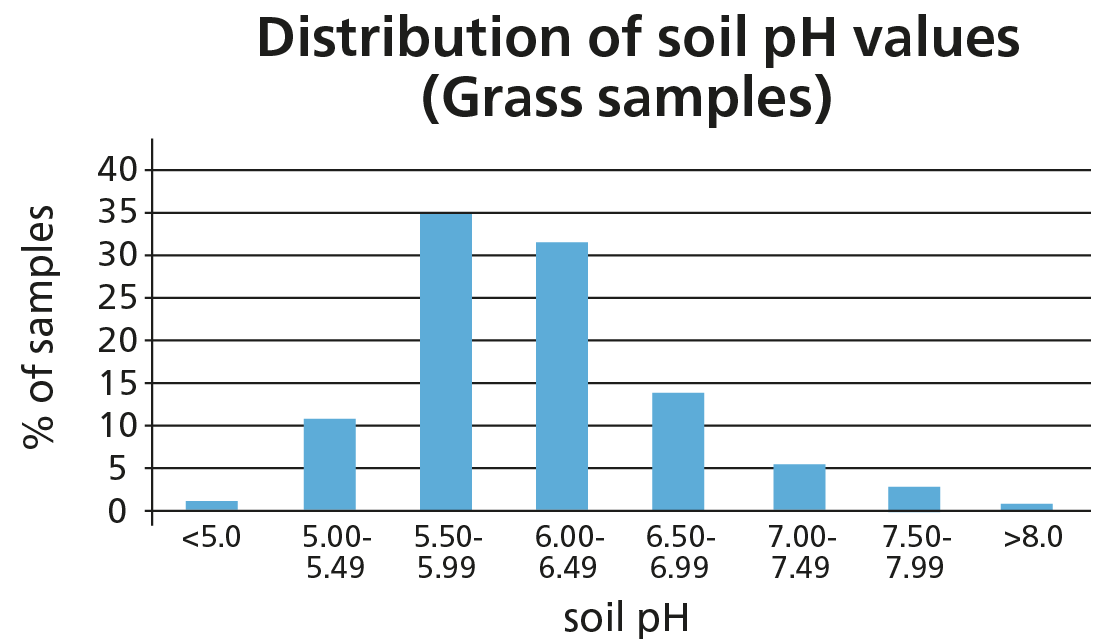
For grassland soils this increases to nearly 50% of all samples analysed being below the lower optimum of pH6. A further 32% could be considered ‘at risk’ by being only marginally above pH6.
Effects of different cultivation systems
The standard depth for sampling is 7.5cm for grassland and 15cm for arable soils. In arable systems this is based on all the work that went into building the Fertiliser Manual over its various iterations from the 1970s onwards, where soils were routinely ploughed, thereby mixing nutrients applied or returned through the soil profile. This gave a relatively homogenous mix (concentration) of nutrients in the soil profile right down to plough depth. Clearly cultivation practices have moved on in the last 50+ years, and the tendency to plough regularly, if at all, has dramatically reduced.
For soils in long-term reduced or no-tillage systems, the results from sampling to 15cm may lead to an artificially high reading giving false confidence that soils are able to supply sufficient levels of nutrients to the crop, which may not be the case due to nutrient stratification in the surface layer. For soils that have been sampled ahead of ploughing which is only carried out occasionally in between minimal cultivations, this again could lead to false confidence if levels are shown to be sufficient, as the impact of ploughing will bury the nutrients to a depth below routine cultivation, and will bring soil of lower nutrient status to the surface ahead of the important establishment phase, where access to phosphate in particular, is key.
For more information on the effect of cultivation systems on soil sampling see the PDA news from December 2020.
Nutrient recycling by grazing animals
Grazing livestock return most of the nutrients they consume to the soil. This sounds good but a glance at any grazed pasture will show that the recycling is not done very well. There are many patches where dung or urine has been deposited but most of the field is unaffected. In paddock grazing systems where there is a high stock density during grazing, uneven distribution is due mainly to concentration of nutrients in dung or urine patches. In continuous grazing, stocking rate might be similar to that in paddock grazing but stock density during grazing is much lower. Here there is an opportunity for animals to camp or spend time in favoured areas so in addition to small scale unevenness in their distribution, nutrients tend to transfer to quite large parts within the grazed area.
So, how do you take account of the recycled nutrients – can you reduce fertiliser application if only a small part of the pasture benefits from recycling? Just to complicate things, there are differences between dung and urine in the number of patches produced, the area of the patches and the proportions of recycled phosphate and potash that they contain.
Paddock systems
Paddock grazing is used mainly for dairy cattle where nitrogen input and herbage yield are relatively high. Even here, nutrients are distributed unevenly by the grazing animals. The proportion of the pasture surface covered can be calculated from the numbers of dung or urine patches produced, their areas and the way they are distributed over the pasture. If there is no overlapping of patches, the proportion of the pasture covered is the average area of a patch multiplied by the number produced and divided by the pasture area. Dairy cows produce around 12 dung patches per day, each of 0.05m2 and 9 urine patches, each of 0.5m2. So, if you know the number of animal days and the area of the field, it’s easy to calculate the proportion of the pasture covered provided there is no overlapping of patches.
However, the phosphate and potash effects of excretal patches last for months or even years and patches will accumulate and start to overlap. Unfortunately, livestock are not considerate, and the distribution of patches is uneven. It’s not even random because the animals have preferred walking or camping areas. Fortunately, this effect has been measured for cattle paddocks and a method developed for calculating the proportion of the pasture covered after allowing for the non-random distribution of patches.
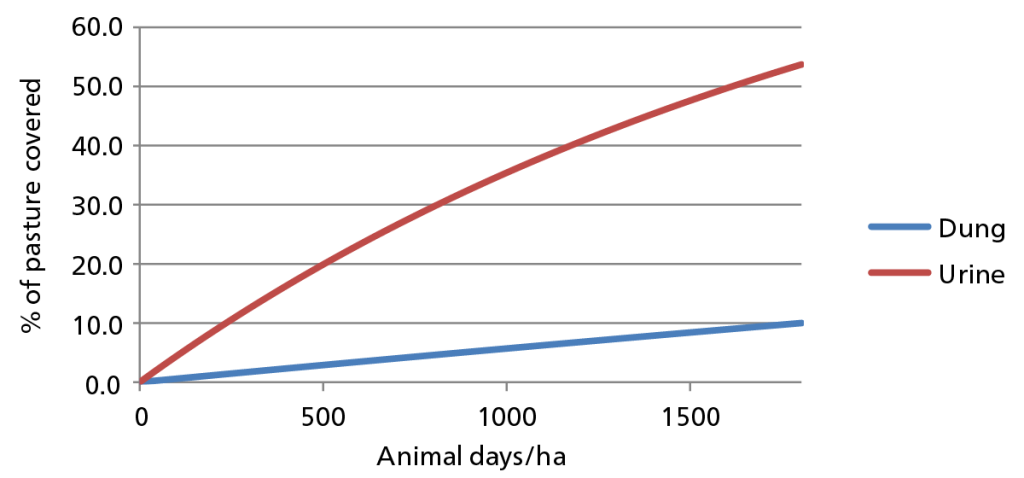
Virtually all the phosphate excreted is in the dung and effects can last for at least two years. After this time, dairy animal days would be 1500-1800/ ha. At this low density of patches, there would be little overlapping so 9-10% of the pasture surface would be covered (Fig 2). This is quite small so the recycling of phosphate by grazing cattle is not easily taken into account when planning fertiliser use. For example, the typical yield of grazed grass for dairy cattle is around 10 t DM/ha containing about 70 kg P2O5/ha of which 65 kg/ha will be returned to the soil. In principle, this would meet most of the need for applied phosphate. However, it is concentrated in a small area so most of the pasture has no benefit.
Much of the potash is in the urine and after two years there would be much overlapping of patches and 50-55% of the pasture surface would be covered. This is a much larger proportion than that for phosphate and means that recycling of potash by grazing cattle can be taken into account in fertiliser use. The requirement for applied potash for intensively grazed grass is small (zero at Index 2 in the Fertiliser Manual).
Continuous grazing
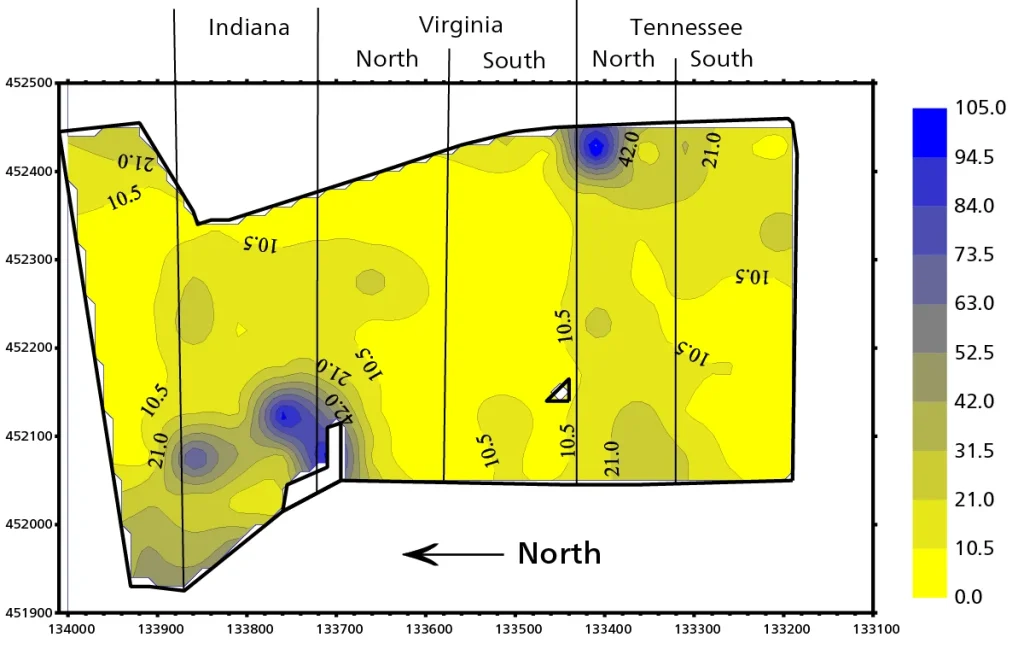
With a much larger area available to them, cattle tend to favour certain parts of the pasture to which nutrients are transferred in deposited dung and urine. Over time this leads to within-field variation in soil P, K and Mg Indices that can be large enough to justify variable applications or at least division of fields into areas that can be treated differently.
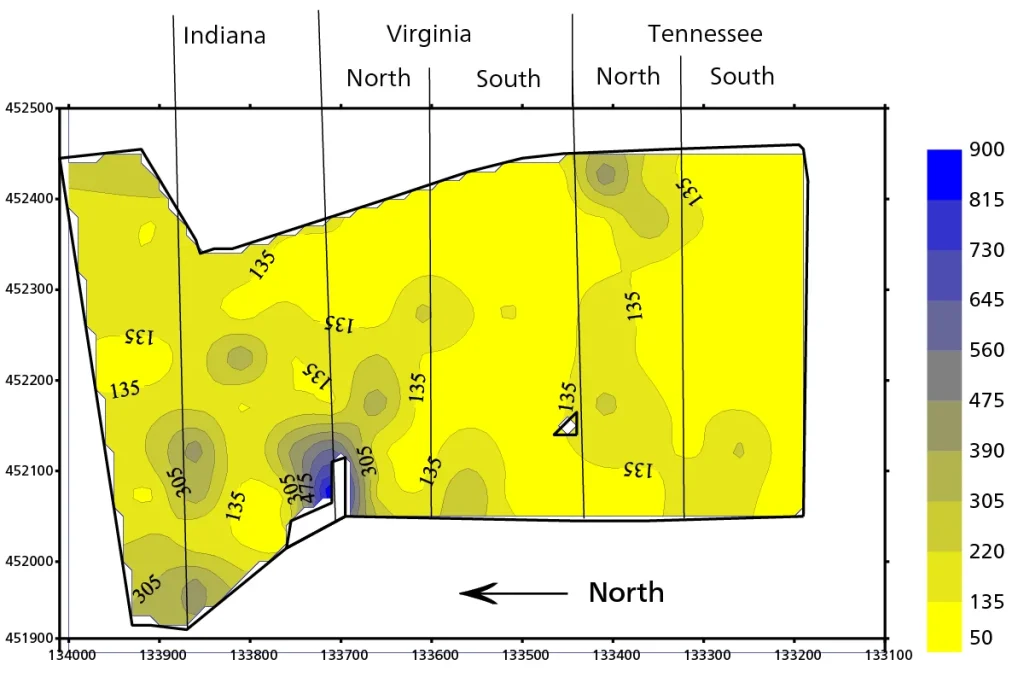
This was illustrated in grid sampling of five grazed fields within a single block of grassland as part of the MIDaS project at ADAS Bridgets. Kriged maps were similar for soil P and K. Most of the field areas were at P or K Indices 0 or 1 but there were hotspots, for example in the lee of a wood, at Index 5. Indices tended to be higher close to the dairy buildings where animals spent more time (Figure 3 & 4).
Implications for soil sampling As phosphate and potash are recycled in small patches that are distributed unevenly across the pasture, no soil sampling strategy will be perfect. Even if enough cores were taken to give a true average soil concentration for the pasture, this would not help if, say, 10% of the pasture were at a high concentration and the rest at a much lower one. So, a compromise must be made and the best method is just to avoid obvious dung patches when sampling. In continuously grazed fields where camping areas are evident, it is best to avoid these if they represent a small proportion of the pasture or to sample and fertilise them separately if they are large.
Summary
Measuring the nutrient status of soils is a requirement of many recent schemes, as well as a legal requirement through the Faming Rules for Water and as such should be conducted on all farmland. However, rather than just being a legislative burden, or an easy option for funding, soil sampling is an essential step in nutrient management planning and therefore should be carried out appropriately and interpreted as best as possible to gain the most from the investment. Alongside sampling, nutrient budgeting and monitoring nutrient balances can be a good measure of identifying potential problem areas where inputs could potentially be cut back, or where further targeting of nutrients may be required. Soils cannot continue to run at a negative balance indefinitely, and whilst it is important to make the most of the nutrients in the soil, extremes of weather, as seen over the last few seasons, just serves to remind us all of how important it can be to get the basics right!
Claim your CPD Points for 2025/26
BASIS Professional Register: claim your points by e-mailing cpd@basis-reg.co.uk for year ending 31st May 2026 quoting reference:
Potash News – 205496063191
PDA Membership – 217362414796
NRoSO: claim 2 points by e-mailing nroso@basis-reg.co.uk for year ending 31st August 2026 quoting reference: NO505967f