
Download pdf: Potassium uptake requirements of some crops (207.18K)
pdf 207.18K
Potassium uptake requirements of some crops
July 2011
Fertiliser recommendations for potash (K2O) are usually based on removal or offtake of K2O at harvest. Some detailed results of measurements on K2O uptake during crop growth show that greater care is needed to ensure potash supply meets crop requirement.
Difference between uptake and offtake
The amount of a nutrient needed for full growth of a crop is larger, sometimes much larger, than the amount removed at harvest.
Crops take up nutrients during their growth (uptake) and some of the quantities taken up are removed from the field at harvest (offtake). The amount taken up and the proportion that is removed at harvest differ between nutrients and among crops. For example, the amount of nitrogen or potash taken up is larger than that of magnesium and much larger than that of manganese. The proportion of a nutrient that is removed at harvest depends on the part of the crop that is harvested (seed, grain, leaves) and on the amount of crop residue left in the field. For example, offtake is a large proportion of uptake in crops like forage maize where almost the whole of the above ground plant is harvested and low in crops like oilseed rape where only the seed usually is removed. The amount of a nutrient in the crop can decrease in later stages of growth due to loss of dead leaves and, in the case of potash, through washing-out by rainfall from the plant as it senesces.
Special role of potassium in water regulation – large amount needed
All nutrients, including potassium (K), have specific biochemical roles in the plant. They might be constituents of proteins like nitrogen, or of cell walls like calcium, or of enzymes and their activators like potassium. Potassium has an additional role in water regulation in the plant. Most of the potassium taken up is in the cell vacuoles which hold much of the water (sap) in the plant and are responsible for keeping the cell rigid, giving it structural strength. If the potassium concentration in the vacuole decreases, the tendency of water to move into the cell reduces and the cell can lose strength and wilt. Plants are also more susceptible to drought stress when there is an inadequate availability of potassium in the soil. The amount of potassium needed for water regulation is large, accounting for the greater uptake of potassium than of nitrogen.
Source of data, value and limitations
The data behind the uptake charts shown below were obtained for the French Ministry of Agriculture and Fisheries at the SCPA Research Station at Aspach le Bas in France. Nutrient contents and dry matter production were measured each week, and provide valuable illustrations of the patterns of nutrient uptake for the four crops shown. Each crop was examined in one year only, but the results are indicative of the quantities and patterns of nutrient uptake during the growing season. Yields for the three crops shown were 8.8 t/ha for wheat, 2.8 t/ha for oilseed rape and 55 t/ha for potatoes. Uptake of nutrients could be greater at higher yields.
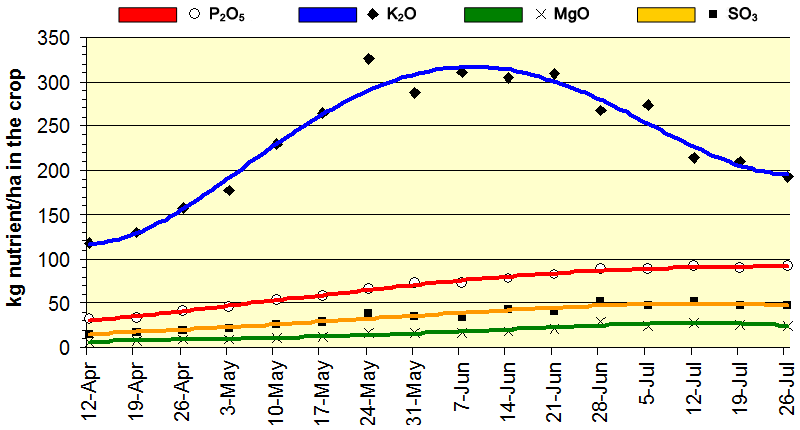
Wheat – total uptake and offtake of K2O, P2O5, MgO and SO3
Amounts of P2O5, MgO and SO3 in the whole crop (including roots) increased steadily during growth of wheat, each reaching and remaining at a maximum level around the end of June (Figure 1). By contrast, uptake of K2O was much greater, reaching a maximum in early June then decreasing to harvest as the crop senesces and dries. In early May, the rate of uptake reached 36 kg K2O/ha/week. At the maximum, the crop including roots contained around 320 kg K2O/ha. At harvest, this had decreased to around 200 kg K2O/ha due to leaf loss and washing-out. The amount removed in the grain was 48 kg K2O/ha, equivalent to only 15% of peak uptake.
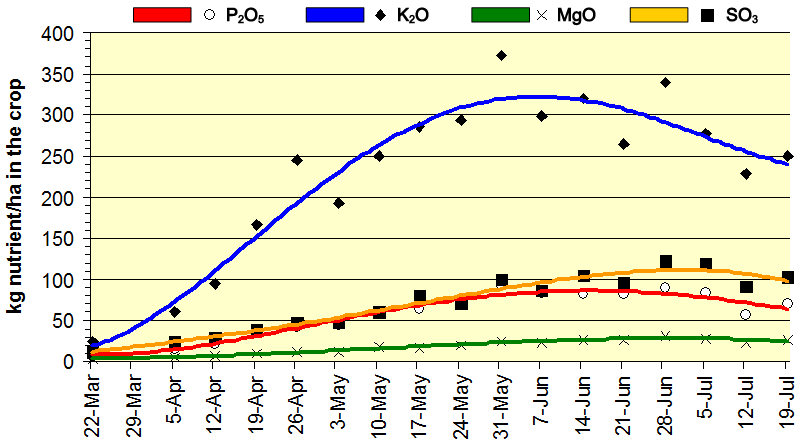
Oilseed rape – total uptake and offtake of K2O, P2O5, MgO and SO3.
Amounts of P2O5, MgO and SO3 in the whole crop (including roots) increased during growth but there was some indication of decreases in P2O5 and SO3 before harvest, probably due to leaf loss (Figure 2). As in wheat, the amount of K2O taken up was much greater, reaching a maximum of around 325 kg K2O/ha at the end of May. The rate of uptake was greatest at around 40 kg K2O /ha/week in the first half of April. By harvest, the amount in the crop had decreased to around 250 kg K2O/ha. Only around 45 kg K2O/ha would have been removed in seed at harvest.
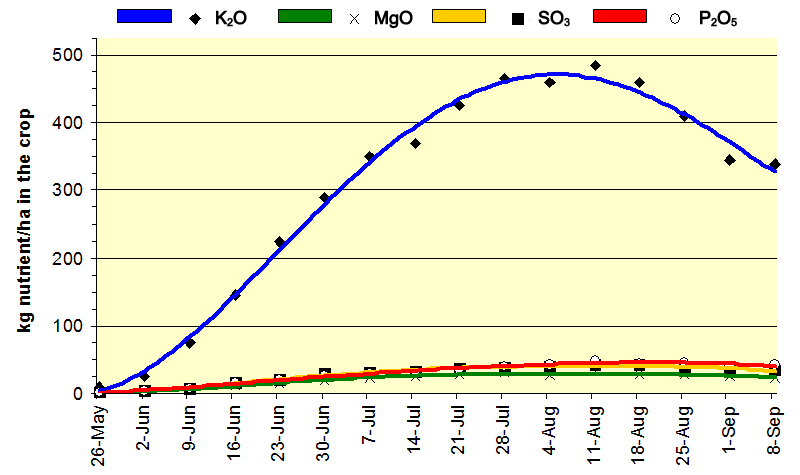
Potatoes – total uptake and offtake of K2O, P2O5, MgO and SO3.
Uptake in the whole crop (including tops, tubers and roots) increased during growth to maxima of around 48 kg P2O5/ha, 32 kg MgO/ha and 43 kg SO3/ha with some decrease in all of these nutrients before harvest. These values were dwarfed by that for K2O which reached a maximum of around 485 kg K2O/ha (Figure 3). Rate of uptake reached nearly 70 kg K2O/ha/week in mid-growth. By harvest, the amount in the whole crop had decreased to around 340 kg K2O/ha of which 305 kg K2O/ha was in the tubers.

The seasonal pattern of K2O uptake in tubers and haulm is shown in Figure 4. The amount of K2O in haulm increased to a maximum of around 200 kg K2O/ha and then decreased to around 30 kg K2O/ha at harvest due to loss of leaves and stems. The amount in tubers continued to increase to around 300 kg K2O/ha at harvest.
Implications for fertiliser policy.
These measurements demonstrate three main points:
- The amount of K2O taken up by crops is much greater than that of P2O5, MgO or SO3 and can reach around 320 kg K2O /ha in wheat and oilseed rape and 485 kg K2O/ha in potatoes.
- The rate of uptake can reach 35-40 kg K2O /ha/week in wheat and oilseed rape and 70 kg K2O/ha/week in potatoes.
- Peak uptake of K2O can be much greater than offtake at harvest.
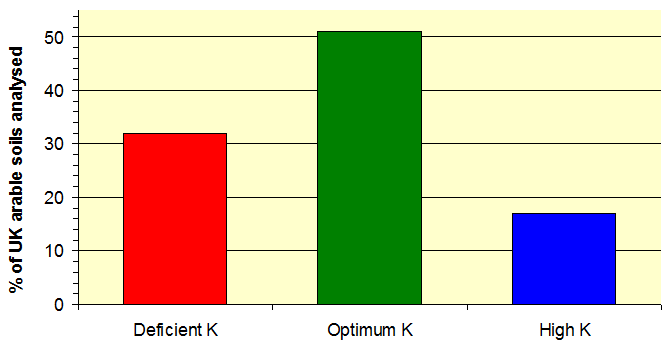
Deficient = Ind. 0 and 1, Optimum = Ind. 2 and 3, High = above Ind. 3
Potash supply must be sufficient to meet these requirements. Where soil Index is at target or higher, normal fertiliser recommendations are likely to be adequate. Greater care is needed where the soil Index is low. The average of the 2009 and 2010 reports from the Professional Agricultural Analysis Group (PAAG) showed that 32% of arable soils analysed were at soil K Index 0 or 1 (Figure 5). On these soils, it is essential that sufficient potash is applied in fertilisers and manures to meet peak requirement which will be significantly more than offtake. Crops should be monitored closely for any symptoms of potassium deficiency and field K2O balance should be recorded every year so that the trend can be identified.
The large dressings of potash required to provide an adequate supply where soil K Indices are low should be applied well in advance of planting, and on non-sandy soils can conveniently be applied during the previous autumn and ploughed down. A proportion of any phosphate, potash and magnesium which is incorporated into the seedbed will end up in the ridge above the mother tuber and, being relatively immobile in soil, is likely to be less available than if it were below the growing plant. This may have a potentially significant effect in soils with low Indices.