Download pdf: Nutrient recycling by grazing cattle (568.06K)
pdf 568.06K
Nutrient recycling by grazing cattle
October 2013
Grazing livestock return most of the nutrients they consume to the soil. This sounds good but a glance at any grazed pasture will show that the recycling is not done very well. There are many patches where dung or urine has been deposited but most of the field is unaffected. In paddock grazing systems where there is a high stock density during grazing, uneven distribution is due mainly to concentration of nutrients in dung or urine patches. In continuous grazing, stocking rate (animals/ha over the year) might be similar to that in paddock grazing but stock density during grazing is much lower. Here there is an opportunity for animals to camp or spend time in favoured areas so in addition to small scale unevenness in their distribution, nutrients tend to transfer to quite large parts within the grazed area.
So, how do you take account of the recycled nutrients – can you reduce fertiliser application if only a small part of the pasture benefits from recycling? Just to complicate things, there are differences between dung and urine in the number of patches produced, the area of the patches and the proportions of recycled phosphate and potash that they contain.
Paddock systems
Paddock grazing is used mainly for dairy cattle where nitrogen input and herbage yield are relatively high. Even here, nutrients are distributed unevenly by the grazing animals. The proportion of the pasture surface covered can be calculated from the numbers of dung or urine patches produced, their areas and the way they are distributed over the pasture. If there is no overlapping of patches, the proportion of the pasture covered is the average area of a patch multiplied by the number produced and divided by the pasture area. Dairy cows produce around 12 dung patches per day, each of 0.05 m2 and 9 urine patches, each of 0.5 m2. So, if you know the number of animal days and the area of the field, it’s easy to calculate the proportion of the pasture covered provided there is no overlapping of patches.

However, the phosphate and potash effects of excretal patches last for months or even years and patches will accumulate and start to overlap. Unfortunately, livestock are not considerate and the distribution of patches is uneven. It’s not even random because the animals have preferred walking or camping areas. Fortunately, this effect has been measured for cattle paddocks and a method developed for calculating the proportion of the pasture covered after allowing for the non-random distribution of patches.
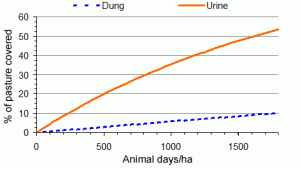
Virtually all of the phosphate excreted is in the dung and effects can last for at least two years. After this time, dairy animal days would be 1500-1800/ha. At this low density of patches, there would be little overlapping so 9-10% of the pasture surface would be covered (Figure 1). This is quite a small percentage so the recycling of phosphate by grazing cattle is not easily taken into account when planning fertiliser use. For example, the typical yield of grazed grass for dairy cattle is around 10 t DM/ha containing about 70 kg P2O5/ha of which 65 kg/ha will be returned to the soil. In principle, this would meet most of the need for applied phosphate. However, it is concentrated in a small area so most of the pasture has no benefit.
Much of the potash is in the urine and after two years there would be much overlapping of patches and 50-55% of the pasture surface would be covered. This is a much larger proportion than that for phosphate and means that recycling of potash by grazing cattle can be taken into account in fertiliser use. The requirement for applied potash for intensively grazed grass is small (zero at Index 2 in the Fertiliser Manual: www.ahdb.org.uk/projects/CropNutrition.aspx).
Continuous grazing
With a much larger area available to them, with continuous grazing cattle tend to favour certain parts of the pasture to which nutrients are transferred in deposited dung and urine. Over time this leads to within-field variation in soil P, K and Mg Indices that can be large enough to justify variable applications or at least division of fields into areas that can be treated differently.

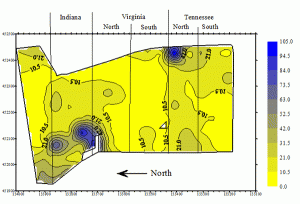
This was illustrated in grid sampling of five grazed fields within a single block of grassland as part of the MIDaS project at ADAS Bridgets. Kriged maps were similar for soil P and K. Most of the field areas were at P or K Indices 0 or 1 but there were hotspots, for example in the lee of a wood, at Index 5. Indices tended to be higher close to the dairy buildings where animals spent more time (Figure 2).
Implications for soil sampling
As phosphate and potash are recycled in small patches that are distributed unevenly across the pasture, no soil sampling strategy will be perfect. Even if enough cores were taken to give a true average soil concentration for the pasture, this would not help if, say, 10% of the pasture were at a high concentration and the rest at a much lower one. So a compromise must be made and the best method probably is just to avoid obvious dung patches when sampling. In continuously grazed fields where camping areas are evident, it might be best to avoid these if they represent a small proportion of the pasture or to sample and fertilise them separately if they are large (see PDA Leaflet 24, ‘Soil Analysis’).

