Download pdf: Nutrient management risks for major crops (224.52K)
pdf 224.52K
Nutrient management risks for major crops
July 2009
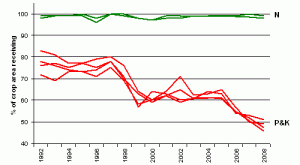
About 70% of the income from arable cropping in the UK (excluding fruit and vegetables) comes from cereals and oilseeds. Given the primary importance of these crops it is surprising that such risks are taken with their performance. Figure 1 shows the area of winter wheat and of oilseed rape which received a dressing of fertiliser nitrogen, phosphate and/or potash over the last 17 years in Britain (from the British Survey of Fertiliser Practice). It is clear that virtually 100% of the crop areas received nitrogen each season, as would be expected. However crop area receiving phosphate and potash over the period has changed significantly. From a dressing cover of between 70-80% in the early 1990s, the cover fell in the late 1900s to 60-65%, and since then has fallen again to a cover of only about 50% in 2008. This pattern of a reduction in the area of cereals and rape receiving phosphate and potash is not seen for other, non-combinable, arable crops.
Data from Defra and BSFP (excluding input from manures)
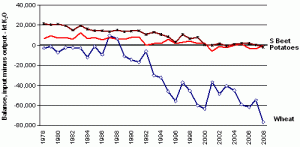
In terms of the overall application rates of nutrients to wheat and rape these reductions in dressing cover mean that mineral fertiliser inputs are significantly reduced. The current overall application rates of phosphate and potash on wheat are similar to those seen in the early 1960s, when wheat yields were half what they are today. Phosphate and potash are applied primarily to replace what is removed in the harvested crop, and current national applications fall very far short. Figure 2 shows the annual balances between inputs and offtakes of potash for wheat, which is removing more than is being applied, and of sugar beet and potatoes which are now in balance, providing no mineral surplus.
The omission of dressings of phosphate or potash does not of course involve an increase in risk if soil nutrient reserves are sufficient. However examination of a number of large-scale UK data sets of the results of soil analysis for potassium shows that about 40% of the samples were at K Index 0 or 1; i.e. the soils were potash deficient. Under these circumstances, not applying potash represents a high risk strategy. Soil analysis is an essential component of decision-making for phosphate and potash applications.
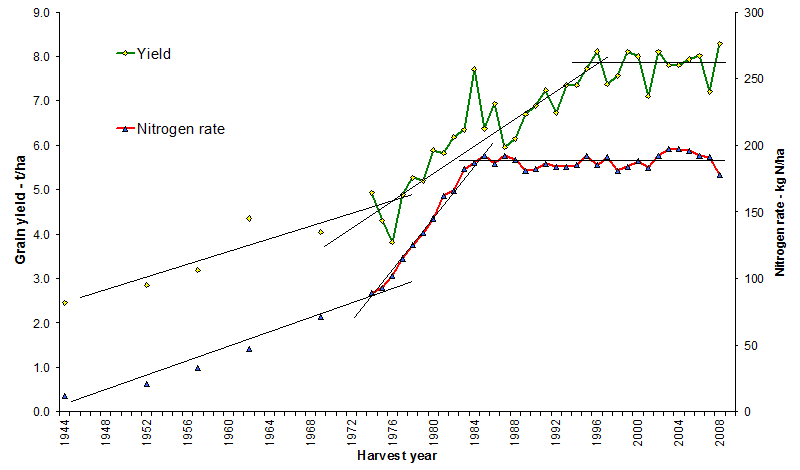
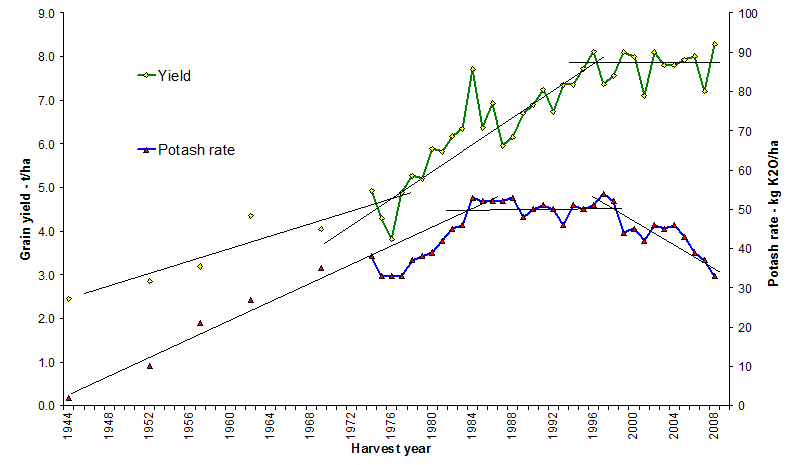
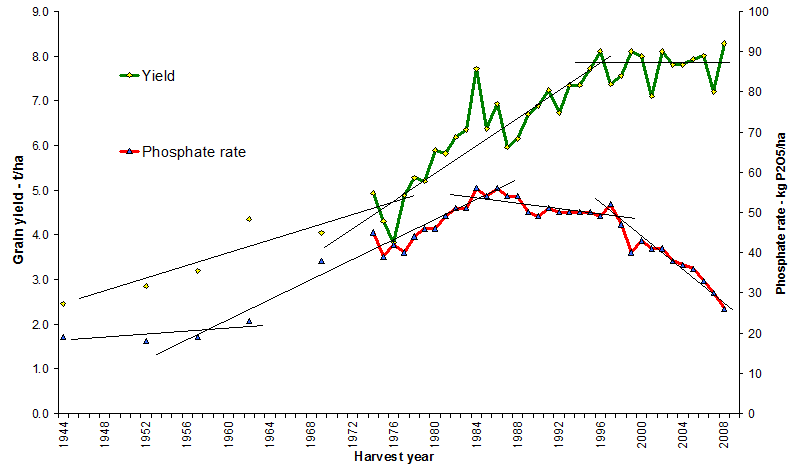
Figure 3 (below) shows the progress of the yield of wheat over the last 60 years or so, and suggests little national improvement since the mid 1990s. Patterns of fertiliser application rates are also shown, although it is not claimed that the lack of yield improvement is necessarily caused by nutrient shortage. Nevertheless it is clear that the current pattern of inputs of phosphate and potash cannot continue, if yields are to be improved or even maintained, and it is of concern that potential yield improvements from new varieties are not being achieved nationally.
Figures 3a, 3b and 3c illustrate the improvement in the yield of winter wheat in England and Wales between 1944 and 2008. The yield can be seen to have increased from about 2.5 t/ha to about 8 t/ha. There are many reasons for this increase, including great progress in plant breeding, pest and disease control and overall husbandry. Fertilisers, in addition to the basic use of manures, have also been a key contributor to this increased productivity. While increasing nitrogen applications have played an essential part in the improvement of yield, applications of phosphate and potash have removed earlier limitations to yield caused by low soil reserves, and were then designed to maintain soil fertility by replacing nutrients removed in harvested products. The continuation of recent trends in phosphate and potash inputs will clearly jeopardise any potential for improvement in the national yield.
