Nutrients in crop material (275.28K)
pdf 275.28K
Nutrients in crop material
Published March 2020
Nutrient offtakes
The information in the table below is essential information for farmers and advisors, and the P2O5 and K2O values can also be found in the AHDB Nutrient Management Guide (RB209), 2020. The values shown are the agreed best estimates of the quantities of phosphate (P2O5), potash (K2O) and guidance of the magnesium (MgO) removed in harvested crop products and in by-products such as straw. These are the offtakes of P2O5, K2O and MgO per tonne of fresh material harvested; to maintain the nutrient fertility of the soil the total offtake must be replaced, through the use of fertilisers and manures (see below for examples of the calculations).
Guidelines for calculation of PHOSPHATE, POTASH and MAGNESIUM removal by crops
| kg/t of fresh material | ||||
| P2O5 | K2O | MgO** | ||
| Winter Wheat | grain only | 6.5 | 5.5 | 2.0 |
| grain plus straw | 7.0* | 10.5* | 2.5* | |
| All other cereals | grain only | 8.0 | 5.5 | 2.0 |
| grain plus straw | ||||
| winter barley/triticale/rye | 8.5* | 10.5* | 2.5* | |
| spring wheat/spring barley | 8.5* | 12.0* | 2.5* | |
| oats | 9.0* | 16.5* | 2.5* | |
| Oilseed rape | seed only | 14.0 | 11.0 | 2.0 |
| seed plus straw | 15.0* | 17.5* | 2.5 | |
| Peas | dried | 9.0 | 10.0 | 3.0 |
| vining | 1.5 | 3.0 | n/d | |
| Field beans | seed only | 11.0 | 12.0 | 2.5 |
| Straw*** | winter wheat or barley | 1.0 | 10.0 | 1.0 |
| spring wheat or barley | 1.0 | 13.0 | 1.0 | |
| oilseed rape | 2.0 | 13.0 | 1.0 | |
| field peas | 4.0 | 16.0 | 1.5 | |
| field beans | 2.5 | 16.0 | 2.0 | |
| Potatoes | tubers | 1.0 | 5.8 | 0.5 |
| Sugar beet | roots only | 0.8 | 1.7 | 0.5 |
| roots & tops | 1.9 | 7.5 | n/d | |
| Grass | fresh grass @ 15-20% DM | 1.4 | 4.8 | n/d |
| silage @ 25%DM | 1.7 | 6.0 | n/d | |
| silage @ 30% DM | 2.1 | 7.2 | n/d | |
| hay @ 86% DM | 5.9 | 18 | n/d | |
| haylage @ 45% DM | 3.2 | 10.5 | n/d | |
| Kale | 1.2 | 5.0 | 0.5 | |
| Forage maize | silage @ 30% DM | 1.4 | 4.4 | 1.2 |
| Wholecrop cereal | 1.8 | 5.4 | n/d | |
| Swedes | roots only | 0.7 | 2.4 | 0.2 |
| Fodder beet | roots only | 0.7 | 4.0 | 0.3 |
| Broad beans | 1.6 | 3.6 | 0.5 | |
| French beans | 1.0 | 2.4 | n/d | |
| Beetroot | 1.0 | 4.5 | n/d | |
| Cabbage | 0.9 | 3.6 | n/d | |
| Carrots | 0.7 | 3.0 | n/d | |
| Cauliflower | 1.4 | 4.8 | n/d | |
| Onions | bulb | 0.7 | 1.8 | n/d |
| Sprouts | buttons | 2.6 | 6.3 | n/d |
| stems | 2.1 | 7.2 | n/d | |
| Bulbs | 2.4 | 6.3 | n/d | |
* Offtake value is per tonne of grain or seed removed but includes nutrients in straw when this is also removed and weight is unknown.
** The magnesium offtakes are based on very limited data and are for guidance only. n/d = no data.
*** Use these values when straw weight is known. Potash content of straw can vary considerably – higher than average rainfall between crop maturity and straw baling will reduce straw potash content. Information on non-cereal straws is limited so values should be used only as a guide.
Standard recommendations
The recommendations for phosphate and potash fertiliser are based on ensuring that the soil has sufficient reserves to supply the crop during growth. This is measured by soil analysis and calculated using the Index system. For agricultural cropping a soil phosphorus Index of 2 or 3 and a potassium Index of 2 are generally considered sufficient to supply the full needs of the crop during its growth. At these Indices the fertiliser recommendation (except for potatoes) is to replace the nutrients removed at harvest. These are called the ‘maintenance’ dressing.
Example calculation:
| 8 t/ha winter wheat crop, straw chopped, removes: | 52 kg P2O5/ha (8 t/ha x 6.5) | |
| and | 44kg K2O/ha (8 t/ha x 5.5) | |
Where crop yield is expected to differ from the standard values in the Nutrient Manual, the recommendations can be adjusted using these offtake values. For example, the standard recommendation of 85 kg/ha P2O5 for wheat at P Index 1 for an 8 t/ha crop should be increased by 2 x 6.5 = 13 kg/ha P2O5 to 98 kg/ha P2O5 if a yield of 10 t/ha is expected, and K2O similarly.
Nutrient offtake and nutrient uptake
The values in the table are the estimated nutrient offtakes. Particularly for potash, these quantities are considerably lower than the nutrient uptake by the growing crop. Although, for example, an 8 t/ha wheat crop removes only about 45 kg K2O in the grain, the growing crop can contain 300 kg/ha K2O; this has to be taken up from the soil which should not therefore be lower than K Index 2. Much of the potash in the crop is returned to the soil as the crop matures, but a considerable amount is retained in the straw, resulting in a much greater offtake value where straw is removed from the field.
The PDA P&K Nutrient Calculator
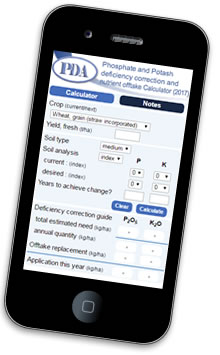
The PDA P&K Nutrient Calculator is available as an app on Apple and Android devices as well as online at the PDA website. The Calculator has two main functions.
- It enables a quick calculation of the phosphate (P2O5) and potash (K2O) offtakes by most UK crops at harvest.
- If soil Indices are below the target level the second section of the Calculator provides a guide to the quantity of nutrient required to correct the deficiency.