24. Soil analysis: key to nutrient management planning (872.20K)
pdf 872.20K
24. Soil analysis: key to nutrient management planning
Published November 2011
Introduction
Soil provides a reservoir of nutrients required by crops and also therefore for animals but not necessarily at optimum levels of immediate availability to plants. The purpose of soil analysis is to assess the adequacy, surplus or deficiency of available nutrients for crop growth and to monitor change brought about by farming practices. This information is needed for optimum production, to avoid transferring undesirable levels of some nutrients into the environment and to ensure a suitable nutrient content in crop products. Farm assurance schemes, buyer’s protocols and codes of practice are increasingly demanding more accurate fertiliser recommendations which must depend on the nutrient-supplying capacity of the soil. Regular soil analysis, every 3-5 years, should be undertaken as a vital part of good management practice.
What is measured
pH, phosphate, potash and magnesium
The “standard soil analysis package” measures soil acidity (pH) and estimates the plant-available concentrations of the major nutrients, phosphorus (P), potassium (K) and magnesium (Mg), in the soil.
Soil acidity is measured as pH (the concentration of H+ ions) with a logarithmic scale running from pH 1 (very acid), through pH 7 (neutral) to pH 14 (very alkaline). The range found when soil sampling is likely to be between pH 4.5-8.5.
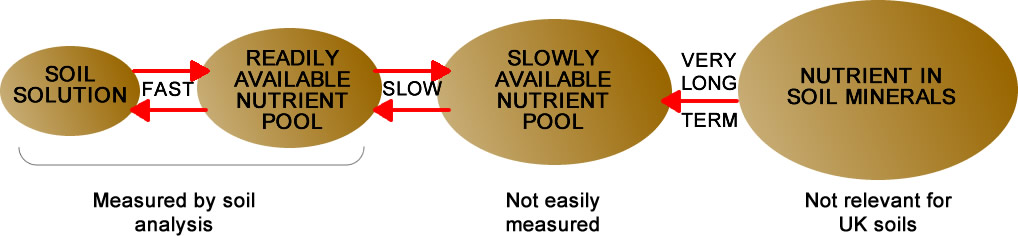
The total P and K content of a soil can be measured exactly but has little relevance to crop yield because only a relatively small proportion of the total P and K in soils is available to the plant (see diagram). Soil analysis in the laboratory therefore uses chemical extractants to provide an estimate of the nutrient which would be available under field conditions. The results provide the best practical guide for determining P, K and Mg in the readily plant-available reserve ‘pool’ shown in the diagram. The methods of soil analysis used in the UK have been developed over many years and have been correlated to crop response, and therefore to fertiliser recommendations, on a wide range of soils in numerous field experiments. Other measurements of nutrient content or ratios may be made on soils, but unless there is dependable correlation with yields, they are of limited practical value.
Available sodium (Na) can also be measured for potentially responsive crops such as sugar beet.
Nutrient reserves in soil
Trace elements
Of the elements required in small amounts by crops – the ‘trace’ elements or ‘micronutrients’ – some can be measured effectively in soil, namely boron (B), chloride (Cl), copper (Cu), molybdenum (Mo), cobalt (Co) and zinc (Zn).
Other elements which are not effectively assessed by soil measurements and need to be measured in herbage or in the animal include manganese (Mn), iodine (I) and selenium (Se).
Heavy metals
In the UK there are statutory soil limits for 7 potentially toxic elements (PTEs) to ensure compliance with EU legislation when sewage sludge is to be applied. These are the ‘heavy metals’ cadmium (Cd), chromium (Cr), copper (Cu), lead (Pb), mercury (Hg), nickel (Ni) and zinc (Zn). The total (acid extractable) content of each of these in soil is measured. The regulations also link the level of these elements to pH which affects their availability to plants. The limits for PTEs are defined in the Sludge (Use in Agriculture) Regulations 1989 and given in the Code of Practice for the Agricultural Use of Sewage Sludge. The Code shows soil limits for additional elements: molybdenum (Mo), selenium (Se), arsenic (As) and fluorine (F).
Nitrogen and sulphur
Measuring available soil nitrogen (N) and sulphur (S) can be useful but is more complex than for other nutrients; these are not covered in this leaflet.
Factors affecting soil analysis
Nutrient values can vary as a result of a number of factors which are discussed below. Further study is needed to define the scale and cause of such variation.
Spatial variation
(see Rules of Sampling 1, 5, 6,8, 9 and 10)
Variation can exist over very short distances (less than 1 metre) and the number of cores that are needed to ensure that sampling is representative of an area will vary according to the scale of this variation. When sampling to obtain an average value for a field this is not so important because all the cores taken are bulked into a single sample; for a typically uniform field 25 cores are sufficient. However, local variation is important when grid sampling because each grid point is viewed as a separate sample. Normally, because the extent of the variation is unknown, at least 16 cores need to be taken on 1 metre grid-spacing around each grid point to provide a single bulked sample for analysis. If it is planned to produce a fully interpolated ‘map’ of the variability of phosphorus or potassium within the field, then the grid points should ideally be not more than 50 metres apart. However cost considerations usually limit the number of sample points to one per hectare i.e. 100 metres apart.
Where considerable differences occur within a field, a single sample can be misleading because the averaging will disguise different treatment requirements. If different areas are known to vary they should be sampled separately. Knowledge of field amalgamations, soil type changes observed when ploughing or cultivating, visual crop growth difference across the field or any other specific information on field variation should be used to ensure that the area is sampled to best effect. Alternatively grid sampling may provide a more detailed picture of in-field variation, albeit at extra cost.
Temporal variation
(see Rules of Sampling 11 and 12)
Variations in nutrient values have been observed at different times of the year and there is evidence to suggest that soil P, K and Mg values may be higher in the early spring than in the autumn as a result of chemical weathering over winter, biological activity and lack of uptake by growing crops.
Moisture
(see Rules of Sampling 13)
If soils are dry at the time of sampling the analytical results can be affected and may appear a little lower for pH, P and possibly K. Movement and uptake of all nutrients will of course be restricted in very dry soils but this is a transient problem and does not reflect the normal availability of nutrients in the soil. At present it is not possible to quantify this effect in order to improve interpretation of analytical results.
Crop removal
(see Rules of Sampling 11)
During periods of rapid growth crop uptake, especially of potassium, can be large and may deplete available soil nutrient levels for a short period until the nutrient status returns to equilibrium. This could affect results for some soils if samples are taken at such times.
Nutrients are returned to the soil in crop residues but will not be determined by analysis until the plant material is broken down. It has been suggested that sampling close to harvest may result in an under-estimation of true soil nutrient status.
Sampling depth
(see Rules of Sampling 4)
Frequently there may be a gradient in nutrient level down the soil profile, usually declining with depth, reflecting the accumulation of nutrients in the plough layer (see section: ‘Effects of different cultivation systems‘). This is accentuated in minimal cultivation systems where phosphate and potash may be concentrated in the top 5 to 8 cm (2-3 inches). With continuous direct drilling there may be a large difference between the top 5 cm (2 inches) and 8 to 15 cm (3- 6 inch) zones. For permanent grass where there is no soil disturbance, a consistent sampling depth of 7.5 cm (3 inches) is particularly important.
Previous manuring
(see Rules of Sampling 14)
Applications of fertilisers and manures obviously have a major impact on measurement of soil nutrients. It is difficult to lay down rules as to how soon sampling should be undertaken after application. General guidelines are:
- 8 weeks after P, K, Mg fertiliser application.
- 12 weeks after slurry or manure application.
- 12 months after lime spreading.
Ploughing and cultivating help distribute nutrients from fertilisers and manures, and lime, throughout the depth of cultivation, but this takes time.
Sampling
Soil analysis data are only as good as the sample taken. A sample normally comprises around 1 kg of soil which is taken to represent an entire area or field, which contains around 2,000 tonnes of soil per hectare to a plough depth of 20 cm (8 inches). It is therefore imperative to obtain as representative a sample as possible or the results will not reflect the nutrient status accurately.
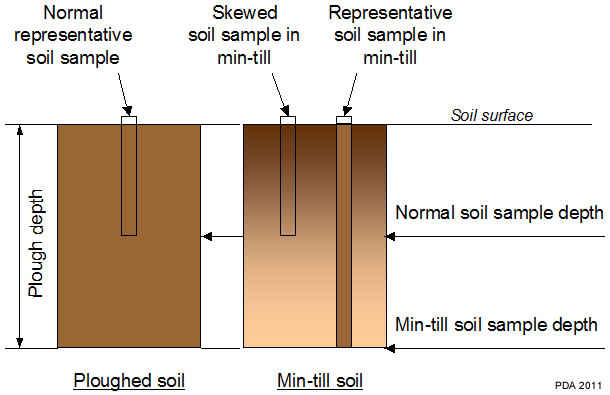
Effects of different cultivation systems
Regular ploughing/cultivation: Nutrients are mixed into a fairly homogeneous soil layer 20-25 cm deep (depending on ploughing depth). Nutrient concentrations in a core taken to 15 cm should be the same as those in the whole mixed layer.
Regular minimum cultivation to 5 cm: Applied phosphate and potash will tend to accumulate in this shallow mixed layer leading to stratification of nutrient concentration in the top of the soil profile. Nutrient concentrations in a sample to 15 cm depth will not be equivalent to those in the traditional mixed layer, which is normally to the depth of ploughing. The samples will not be comparable and will tend to over-estimate the supply of phosphate and potash available to the crop.
Occasional ploughing after several years of minimum cultivation: The soil layer that is mixed by minimum cultivation (and relatively rich in nutrients) will be buried by ploughing to a depth that is not accessed during normal soil sampling. Samples taken after ploughing can underestimate the supply of phosphate and potash available to the crop in these systems.
Rules of sampling
Interpretation of soil P, K and Mg
Soil analysis provides an estimate of available P, K and Mg concentrations in soil to sampling depth – in practice this is equivalent to plough or cultivation depth because of the distribution of nutrients when the land is worked. Response experiments with different crop groups have provided the relationship between crop yield and soil nutrient concentration. Normally, yields increase with increasing nutrient concentration to a maximum, beyond which there is no further benefit from additional nutrient. Below this value, which will vary with crop species, there is a yield penalty. Whilst soil analysis is not a precise guide, the lower the value the greater the risk of poor performance. To aid interpretation of the different concentrations of individual nutrients, Index or descriptive scales are used. These scales provide a general indication of the likely crop response and therefore a guide to the need for additional nutrient supplementation, as shown in the table.
Crop response and soil analysis
| Defra Index | SAC description | Yield response to added nutrient by | |
|---|---|---|---|
| vegetable crops | arable crops and grass | ||
| 0 | Very low | highly likely | highly likely |
| 1 | Low | highly likely | probable |
| 2 | Moderate | likely | unlikely |
| 3 | High | possible | nil |
| 4 | Very High | unlikely | nil |
| 5 | Very High | nil | nil |
Frequency of sampling
Soil nutrient levels do not alter markedly over short periods of time unless major factors of supply or demand are introduced. There is therefore no point in incurring the additional cost of sampling more frequently than necessary, except perhaps as a check to ensure that earlier sampling has been carried out properly. Additional sampling may be justified when there is a major change to husbandry practice – for instance alteration of cropping or manure policy. General guidelines for sampling frequency are as follows:
| Sample every | ||
|---|---|---|
| Permanent grass | 7 years | |
| Intensively used grassland | 3-4 years | |
| General arable cropping | 3-5 years | |
| Arable/grass systems | 3-5 years | |
| Field vegetables and horticulture | 2-3 years |
Interpretation of soil pH
The recommended target soil pH values for England, Wales and N Ireland and for Scotland are shown in the table below, for arable and grassland on mineral and peaty soils. pH values quoted from laboratories throughout the UK are numerically equivalent, even though the extractant is not always water. The Scottish SAC laboratory uses calcium chloride solution (0.01 M CaCl2) but pH values are converted to be equivalent to those obtained using water. The recommended values in the table are therefore applicable wherever the soil has been analysed.
| England, Wales and N Ireland1 | Scotland2 | |||
|---|---|---|---|---|
| Optimum soil pH | ||||
| Mineral soils | Peaty soils | Mineral soils | Peaty soils | |
| Continuous arable cropping | 6.5* | 5.8 | 6.0-6.2 | 5.7-5.9 |
| Continuous grassland | 6.0 | 5.3 | 6.0 | 5.3-5.5 |
| 1 For more detailed information see the Fertiliser Manual [RB209] 8th Edition, Section 1. 2 For more detailed information see the SAC Technical Note TN656 * in arable rotations growing acid-sensitive crops such as sugar beet, maintaining soil pH between 6.5 and 7.0 is justified. |
||||
In-field measurements using pH indicator on some soils where free chalk or lime particles exist may give lower values than laboratory results for the same field. This is because grinding the soil for laboratory analysis pulverises any chalk/lime particles and the pH as measured is increased.
Acidity below pH 6.0 will reduce the availability of some nutrients, especially phosphorus.
Availability of trace elements is radically affected by pH and the need for trace elements should be assessed only after any required amendment of acidity has been undertaken and has had time to take effect.
Influence of soil pH on plant nutrient availability
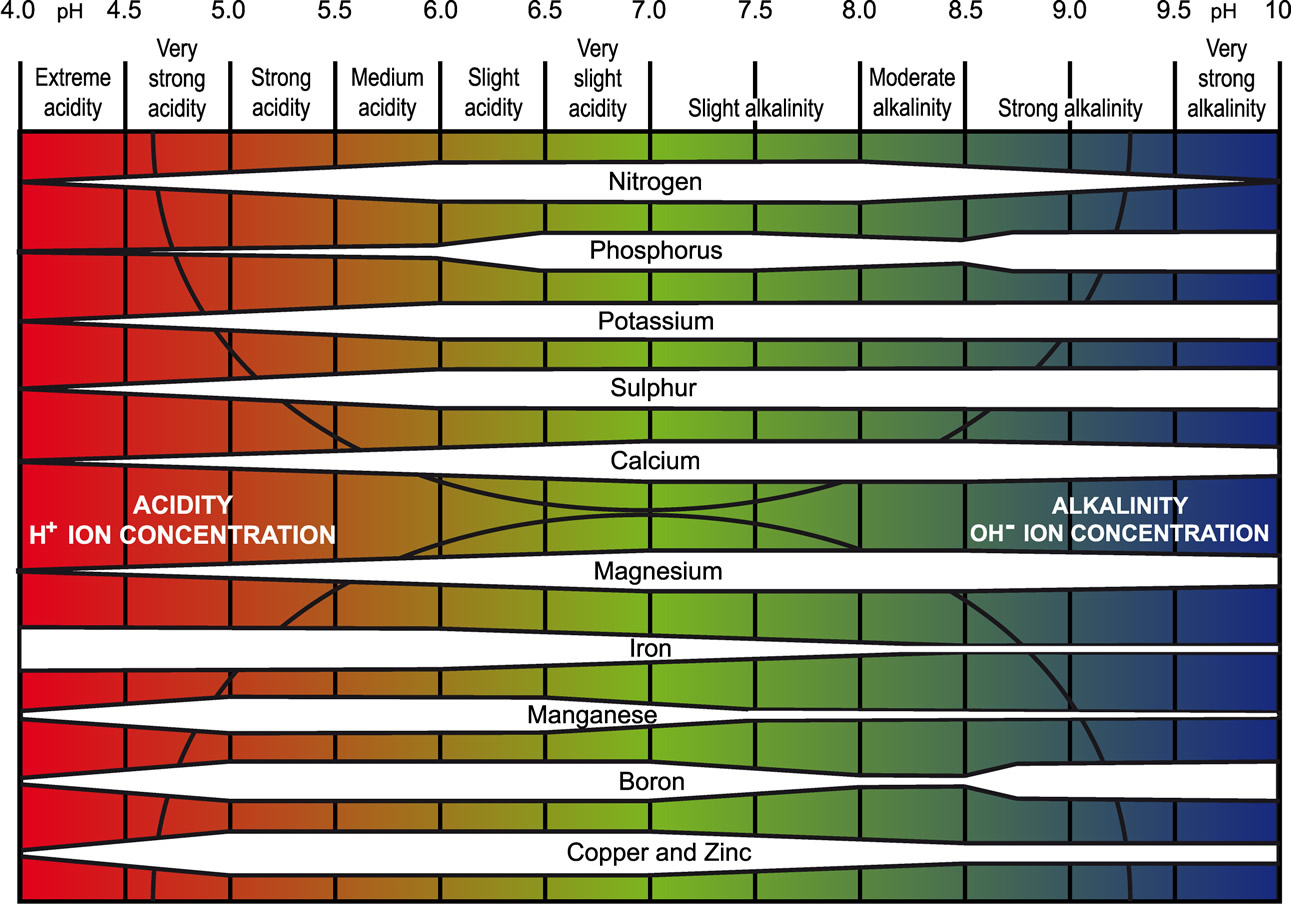 The availability of different nutrients at the different pH bands is indicated by the width of the white bar: the wider the bar, the more available is the nutrient (redrawn for PDA from Truog, E. (1946). Soil reaction influence on availability of plant nutrients. Soil Science Society of America Proceedings 11, 305-308.).
Analysis
There are several reasons why different results may be obtained for apparently identical samples analysed by different laboratories. The most obvious reason is that different extractants may have been used. Variations in results can also occur if identical protocols are not followed – techniques of soil drying, grinding and sieving, reagent and equipment temperature, extractant concentrations, extraction shaking, stirring and filtration, and extraction time can all affect the result. Results are usually reported in mg/l but where a laboratory measures soil by weight instead of volume, the units will be as mg/kg. This can give rise to differences on some soils – particularly those with high levels of organic matter. The Professional Agricultural Analysis Group (PAAG) was established in the UK in 2009 to operate a ring test of participating laboratories to ensure commonality among those in the Group, who all use the official English, Welsh and Northern Irish methods for soil analysis identified in The Fertiliser Manual (RB209). The Group also publishes an annual Report on the overall nutrient status of the soils which have been analysed by members.
If different laboratories are used for analyses these factors must be taken into account.
Soil P, K and Mg concentrations (mg/l) and Defra Index scale
Note that the Index is split in half for potassium only and described as 2- (or lower Index 2) and 2+ (or upper Index 2). In the past, Index 2 was not divided in half for potassium but some soil reports used + and – signs to denote the extreme top and bottom 10% of each band; laboratories should no longer be using this convention.
| PHOSPHORUS | POTASSIUM | MAGNESIUM | |||
|---|---|---|---|---|---|
| Olsen extraction | Ammonium nitrate extraction | ||||
| Olsen P | exchangeable K | exchangeable Mg | |||
| Index | mg/l | Index | mg/l | Index | mg/l |
| 0 | 0-9 | 0 | 0-60 | 0 | 0-25 |
| 1 | 10-15 | 1 | 61-120 | 1 | 26-50 |
| 2 | 16-25 | 2- | 121-180 | 2 | 51-100 |
| 2+ | 181-240 | ||||
| 3 | 26-45 | 3 | 241-400 | 3 | 101-175 |
| 4 | 46-70 | 4 | 401-600 | 4 | 176-250 |
| 5 | 71-100 | 5 | 601-900 | 5 | 251-350 |
| 6 | 101-140 | 6 | 901-1500 | 6 | 351-600 |
| 7 | 141-200 | 7 | 1501-2400 | 7 | 601-1000 |
| 8 | 201-280 | 8 | 2401-3600 | 8 | 1001-1500 |
| 9 | over 280 | 9 | over 3600 | 9 | over 1500 |
Besides providing a basis to decide fertiliser quantities, soil analysis should also be used to monitor changes in fertility especially where there are uncertainties in the amounts of nutrient removed (e.g. with forage crops) and in the amounts of nutrients applied (e.g. with manures and slurries). For this purpose it is desirable to use the mg/l values not the Index. However differences of less than 5 mg/l Olsen P, 25 mg/l K and 10 mg/l Mg should be ignored unless part of a sustained trend. Where accurate nutrient balance information is used in conjunction with regular soil analysis, it is important to recognise the possibilities of variation as outlined above.
Soil P, K and Mg concentrations (mg/l) and SAC descriptive scale
The SAC laboratory in Scotland uses different extractants to those used in England, Wales and N Ireland, and a descriptive rather than a numeric scale.
| SAC Status | PHOSPHORUS | POTASSIUM | MAGNESIUM |
|---|---|---|---|
| Modified Morgans extraction | |||
| mg/l | mg/l | mg/l | |
| Very low (VL) | 0.0-1.7 | 0-39 | 0-19 |
| Low (L) | 1.8-4.4 | 40-75 | 20-60 |
| Moderate – (M-) | 4.5-9.4 | 76-140 | 61-200 |
| Moderate + (M+) | 9.5-13.4 | 141-200 | 61-200 |
| High (H) | 13.5-30.0 | 201-400 | 201-1000 |
| Very high (VH) | >30.0 | >400 | >1000 |
Relationship between Defra and SAC scales
| Defra Index | SAC description |
|---|---|
| 0 | Very low |
| 1 | Low |
| 2 | Moderate |
| 3 | High |
| >3 | Very high |
Principles of P, K and Mg manuring
The principle of manuring is to maintain plant-available soil nutrient levels within a target range depending upon crop rotation and soil type, by replacing nutrients removed at harvest. Soil analysis shows the status of soil nutrients relative to the target values and allows changes as a result of husbandry to be monitored. Where soils are below the target level, nutrient applications should provide more than is removed by the crop to help ensure full yield response and to improve nutrient levels. Nutrient applications for soils above the target range may be reduced or omitted until the soil reserve approaches the target value. Additional nutrients may be applied before very deficiency-sensitive crops such as potatoes with the surplus balance being allowed for in subsequent less sensitive crops. The overall nutrient balance in the rotation should be estimated and then checked by regular soil analysis.
Target levels
| Soil P | Soil K | |
|---|---|---|
| Arable and forage crops | Index 2 (Olsen P) 16-25 mg/l |
Lower index 2 120-180 mg/l |
| Vegetables and potatoes | Index 3 (Olsen P) 26-45 mg/l |
Upper index 2 181-240 mg/l |
Sand soils
On true sand-textured soils (not loamy sands or sandy loams) it is not practical to attempt to maintain a soil K Index of 2- and the target K level should be adjusted to 100-120 mg/l (Index 1+).
Chalk and limestone soils
At very high pH, potash additions are more likely to be converted to slowly available reserves in the soil and it will be more difficult to raise the soil K Index. However soil K targets and replacement principles for application remain the same as for other soils.
Other factors affecting interpretation
Soil structure is also very important because any restriction to root growth may restrict the plants ability to obtain an adequate nutrient supply despite a satisfactory value indicated by analysis. The remedy is not to apply more nutrient but to improve the soil structure.
Organic matter – The level of organic matter (humus) will also affect the availability of nutrients in a soil and regular addition of manures so that the physical conditions and biological activity is improved will increase the plant-available nutrients.
Stone content can also have a large effect upon nutrient supply. Very stony soils have little fine earth yet it is the nutrients in this fine earth fraction that are measured. In consequence it is advisable to maintain very stony soils at slightly higher levels of available P and K than are required on deep stone-free soils.
Soil depth – Crops frequently access some nutrients from below sampling depth and from subsoil (especially potash). Soils with greater rooting depth potential offer a greater soil volume, and provide larger total quantities of nutrient than shallow soils. It may be possible to manage deep, well textured soils at slightly lower concentrations than the stated targets given above. However shallow rooting crops which do not explore the full soil volume will still require normal nutrient concentrations.
Changes in soil nutrient status
Changes in nutrient status relate to the balance between nutrients applied and removed or lost (little P, K or Mg is leached or lost from most properly managed UK soils). Nutrient balances per hectare are normally small especially in comparison with the total quantity of soil nutrients per hectare. Where the balance is positive not all the residual phosphate or potash applied remains as immediately available soil P and K and therefore only small changes in soil status should be expected. Large changes, where not related to very large nutrient balances, need to be investigated.
Improving soils with low nutrient status
Soil analysis measures the average nutrient concentration in the depth of soil sampled; theoretically a concentration of 1 mg/l to a depth of 10 cm in soil represents 1 kg/ha of (elemental) nutrient. In practice however, plants also obtain nutrients from below sampling depth and from the slowly available pool that is not measured by analysis (see diagram above). This often gives rise to some confusion especially as these sources are very variable depending on soil type and past fertilisation and manuring. It is therefore possible to have a soil at 125 mg/l of K (Index 2) which supplies a cereal crop with a peak uptake of 250 kg/ha K (300 kg/ha K2O).
Conversely the addition of 100 kg/ha of phosphorus, potassium or magnesium (in fertiliser terms this represents 230 kg P2O5 120 kg K2O and 170 kg MgO) will not result in an increase of 100 mg/l of readily plant-available soil P, K or Mg. This is because some of the nutrient applied will not remain in the readily available pool measured by analysis. Unfortunately the proportion remaining available and thus affecting soil analysis values will differ widely with different soils and conditions and is not reliably predictable.
With present knowledge it is not possible to provide more than a very rough guide as to how soil values will change with additions (or removals) of nutrient. The following figures have been suggested but it is likely that the range in practice is even wider than indicated:
To increase soil Olsen P by 10 mg/l requires approximately 400-600 kg/ha P2O5
To increase plant-available soil K by 50 mg/l requires approximately 300-500 kg/ha K2O
More potash will be required on heavier soils where the clay type can make a difference. Where either the P or K status needs to be increased, triple superphosphate and muriate of potash (KCl) respectively are cost-effective nutrient sources.
Treatment of high fertility soils
No additions of nutrient (fertilisers or manures) need be made to any soils above Index 3 (arable) and 4 (vegetables).
Soils at Index 3 should receive maintenance dressings of phosphate but there is no need for potash for most arable crops (except potatoes) or grassland.
Some clay soils contain very large reserves of potash which are not reflected in the level of available K shown by normal analysis. In these cases the amount of slowly available K released each season may be sufficient to replace some or all of the potash removed in combinable crop rotations, especially where the straw in not removed (the higher demand of root crops and cut grass normally requires some addition). The soil K value may not change over many years cropping even though little or no potash is used to replace that removed. Not all heavy soils have this ability and where less nutrient is applied than is removed, soil levels must be regularly monitored for any reduction in plant-available K.
Conclusion
Whilst soil analysis is not a perfect tool, it is the most effective and practical means of assessing soil fertility in respect of pH and plant-available P, K and Mg. Analytical data should be used in conjunction with other knowledge such as soil type, structure and crop offtake as the basis for deciding on fertiliser and manure use.