11. Potash for cereals (1.16M)
pdf 1.16M
11. Potash for cereals
Published August 2023
Introduction
There is always pressure on cereal farmers to reduce costs. Typical expenditure on fertilisers for cereals is usually around a half of total cereal variable costs making this a common target for cost cutting. Basal phosphate and potash are particular targets because reductions in use that damage yield, or increase susceptibility to stress, may have little or no visible short-term effect. This leaflet provides a comprehensive review of phosphate and potash nutrition for cereals as well as exploring the benefits of sulphur and magnesium.
Potash application is not matching offtake
Since the mid 1990s, average potash usage in England and Wales has been less than potash removed in cereal grain and straw resulting in an inevitable reduction of soil potash reserves. A similar imbalance has developed for some other main arable crops and this also applies to phosphate. These trends have continued and will lead to serious consequences for yield and quality. The length of time before financial penalties occur will depend on soil type, manure use and the phosphate and potash reserves of individual fields.

(NB Inputs from manures are not included)

(NB Inputs from manures are not included)
The area of cereals receiving no annual phosphate or potash at all has also increased significantly in recent years with over 60% of the winter wheat area sown receiving no fertiliser phosphate or potash. As only around 20% of arable soils are at an Index where phosphate and potash can safely be omitted for cereals, this is further evidence of imprudent cost cutting.
It must not be assumed that because cereals are known to be efficient scavengers of phosphate and potash and because no visual symptoms are seen, that such cost cutting is without penalty. Serious economic consequences can occur without any visible symptoms of deficiency. Soil P and K Indices may decline only slowly but as they fall below accepted threshold levels, the risks of yield and quality losses increase. Such risks are not worth taking because of the essential requirement of these nutrients for the maintenance of yield and quality.
Potash affects grain yield and quality, crop vigour and drought resistance
Potash affects both yield and quality of grain as well as the general health and vigour of the plant. Cereal crops need at least as much, if not more, potash than any other nutrient including nitrogen. Potash is needed in such large amounts because it is the major regulator of solution concentrations throughout the plant. It controls cell sap content to maintain the turgor of the plant and supports the movement of all materials within the plant. Potash supply is thus essential for all nutrient uptake by the roots and movement to the leaves for photosynthesis, and for the distribution of sugars and proteins made by the green tissue for plant growth and grain fill.
The practical implications of shortage of potash are summarised in the following list:
- Low yield
- Inefficient nitrogen response
- Increased risk of nitrogen loss
- Reduced 1000 grain and specific weights
- Reduced grain ripening duration
- Fewer grains per ear
- Poorer grain sample
- Weaker straw
- Increased risk of lodging
- Increased susceptibility to drought
- Increased pest and disease susceptibility
Effect on cereal yield components
Adequate available potash is essential to produce high-quality marketable grain with good specific weight and well filled grains. A shortage will result in premature ripening with significantly lower individual grain size and weight and will also prevent some potential grain sites from developing, thus reducing the number of grains per ear.
| Level of Potash | |||
|---|---|---|---|
| Deficient | Intermediate | Sufficient | |
| Days from flowering to ripening | 46 | 68 | 75 |
| Grain number per ear | 36 | 38 | 43 |
| 1000 grain weight (g) | 17 | 33 | 34 |
Effect on straw strength
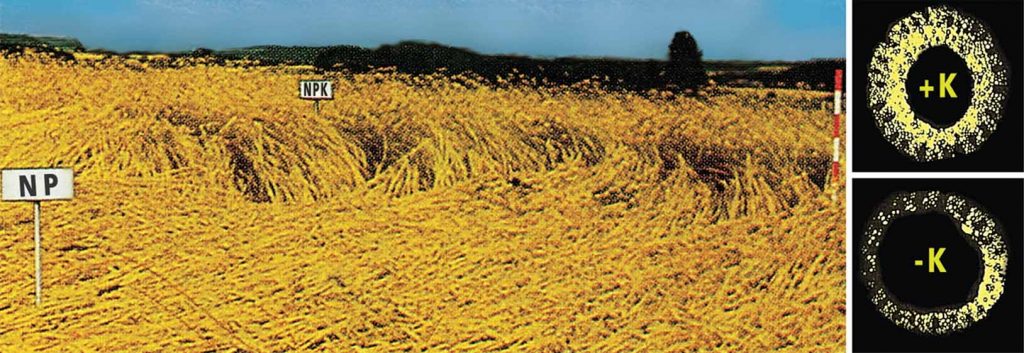
Potash enhances the development of strong cell walls and therefore stiffer straw. Lodging is affected by obvious factors such as variety, nitrogen rate and weather, but low potash levels also increase the risk of lodged crops with the associated loss of yield and quality. The effect can be as dramatic as a lack of growth regulator in some circumstances as illustrated in the photograph below.
Effect on plant vigour, health and stress resistance
In the absence of satisfactory potash supply, plants will be poor and stunted, especially in dry seasons. Physiological stress will be more damaging if potash nutrition is limiting – frost damage will be more severe, waterlogged areas will take longer to recover and plants will wilt earlier and remain flaccid for longer under drought conditions.
Crops will be more susceptible to disease and pests especially where nitrogen and potash availability are imbalanced. This will result in weaker, sappier growth which will contain a higher concentration of soluble nitrogen compounds and simple carbohydrates providing a readily available food source and attractive focus for pathogens and insect pests such as aphids. Thinner cell walls with less mechanical resistance to predators may also result from potassium shortage. A review of over 1000 cereal trials found that where potash levels were low and out of balance with nitrogen supply, application of potash reduced disease and bacterial infections in over 70% of cases.
Potash is needed for full response to nitrogen

Cereals require a balance of nitrogen and potash to obtain full yield response to applied nitrogen. Careful optimisation of nitrogen is a waste of time if potash supplies are not adequate. As shown in the diagram, both the level of yield and the shape of the nitrogen response curve, along with the optimum nitrogen rate, are totally altered by potash limitations.
If potash supply is limiting, the uptake and utilisation of nitrogen will be restricted. If soluble forms of nitrogen remain in the soil and are not taken up there is increased risk of leaching when through-drainage occurs. Ready availability of both nutrients at peak crop demand helps the uptake of the large requirements of nitrogen and potash. During rapid vegetative growth, the rapid uptake of nitrogen as negatively charged nitrate ions (NO3–) is normally balanced by a similar uptake of positively charged potash ions (K+) which maintains the electrical neutrality of the plant. Adequate potash is clearly important in the production of quality wheat as it assists the conversion of nitrate to protein. Nitrogen stimulates cell production but for new cells to grow to full functionality, adequate potassium must be available to achieve its essential concentration in the cell ‘sap’, otherwise cell growth will be restricted.
For more information see PDA Leaflet 22: NK Arable Top Dressing.
Identifying potash deficiency
Visual symptoms
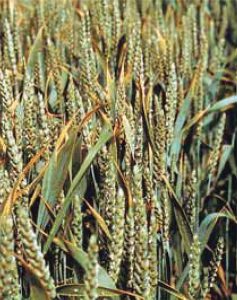
Potassium deficiency causes yellowing and chlorosis to the edge and tip of older leaves, with progressive senescence. Plants may be stunted and exhibit excessive basal tillering. Symptoms are not easily distinguished from those resulting from many other causes especially from physiological stress – drought, water-logging, wind etc.
By the time such symptoms are seen it is almost certainly too late to remedy the situation and avoid yield loss. Potassium deficiency is sometimes referred to as ‘hidden hunger’ because losses occur before any recognisable visual symptoms. Two crops that differ in yield by 10% at harvest cannot be distinguished visually during growth. Visual diagnosis is thus a totally unsuitable means of detecting potassium shortage. Soil analysis is the most cost-effective approach providing an indication of adequacy or deficiency for future crops.
Soil analysis
Knowledge of the fertility level in the soil is clearly essential to deciding fertiliser policy. It is impossible and irresponsible to guess correct fertiliser use without soil analysis, which should be undertaken every 4-5 years. Soil analysis provides a measure of the nutrient level available to the crop – the total level of potash (and phosphate) in any soil is very much larger, but most is not available for current plant use. The physical condition of a soil is also of vital importance, e.g. structure, depth of soil, level of organic matter and stone content. These must be considered first before interpreting soil analysis (see PDA Leaflet 24).

A very large number of cereal trials on different soil types in different regions have been undertaken to establish how cereal performance is related to the available nutrient supply as measured by standard methods of soil analysis. Yields increase with increasing soil K up to what is described as a critical level, beyond which further improvement in soil potash fertility has no effect. Similar data confirm the same principle for soil P. Because soil fertility varies within fields and according to soil conditions and climate, soil analysis is not as precise a measurement as these data suggest. The Index system has therefore been developed to provide the general pattern of crop response to added nutrient. Soil K Index 2 is divided into a lower and an upper half denoted by minus and plus signs, with 2- as the safe Index for arable crops.
Soil analysis and cereal crop response
| Soil P Index | mg/l | Yield response to added nutrient | Soil K Index | mg/l |
|---|---|---|---|---|
| 0 | 0-9 | Large response likely | 0 | 0-60 |
| 1 | 10-15 | Response likely | 1 | 61-120 |
| 2 | 16-25 | No response / response unlikely | 2- | 121-180 |
| No response | 2+ | 181-240 | ||
| 3 | 26-45 | No response. Good reserves | 3 | 241-400 |
| 4 | 46-70 | Excess nutrient present | 4 | 401-600 |
Recent trial work carried out by Teagasc in Ireland have shown big responses to both soil potassium levels and potash application rates on low index soils. The trial below (left) shows the improvement in spring barley yields from crops grown on an index 2 soil, compared with those grown on soils with an index 1, even where applications were made in season. The trial on the right shows the improvement in yields of spring barley on a very low index 1 soil to differing rates of potash applied.


Tissue testing
Soil analysis indicates the potential supply of potash to a crop. It cannot tell you if sufficient potash is getting into the crop, only tissue testing can do that. Tissue testing can be used to assess the potassium status of a growing crop but can come too late in the season to enable a deficiency to be corrected. Tissue testing can be used as an adjunct to soil analysis or as an extra diagnostic tool in specific circumstances. The maintenance of an adequate level of soil potash can be achieved at relatively low cost and will normally ensure that crop needs are being met without the need for tissue sampling and analysis.

Where tissue testing is used, measurement of tissue water (cell sap) is recommended. This indicates whether K concentrations are at or below optimum levels and is more reliable and meaningful than measurement of K content in the dry matter. Percent K in dry matter varies widely with season, stage of growth, part of plant, fertiliser (nitrogen or potash) application and weather or other factors which affect nutrient uptake and rate of growth.
Work at Rothamsted Research funded by the AHDB has indicated that adequacy of potash in winter wheat is represented by tissue water concentration in leaf 1 (the youngest mature leaf blade) between 5.8 and 7.8 g K/litre (150 and 200 mM K) for growth stages between GS31-61. Plant concentrations below this range may result in yield penalties.
There is an advantage in assessing the K status of a crop as the concentration of K in the tissue water, as illustrated below. A significant difference can easily be seen between an adequate and severely deficient supply of K to this spring barley crop, and this distinction is constant and apparent over the period of active growth and DM production.
There are unfortunately difficulties in reporting K as a concentration in tissue water because the laboratory will need to receive the plant material with its full content of tissue water (i.e. without any loss through wilting etc.) in order to measure the initial fresh weight of the sample before drying and determination of the dry weight and K content. The maintenance throughout growth of an adequate K concentration in the tissue water of about 200 mmol K/kg is equivalent to about 0.8% K in the tissue water. For a sample at 20% dry matter this equates to about 4% K in the dry matter.

Peak potash uptake is much greater than offtake at harvest

Potash uptake during establishment is low with winter wheat typically containing around 40-50 kg K2O/ha over winter; more forward winter barley crops may contain up to 80 kg K2O/ha. Whilst these amounts are relatively small, a deficiency of nutrient at this early stage clearly can have critical effects and where soil potash levels are low (mid Index 1 or below) some potash should be applied to the seedbed – ideally placed close to the seed if the soil reserves are very low. As the crop reaches tillering and starts to make vigorous vegetative growth, potash and nitrogen uptake increase very rapidly as shown in the diagram opposite. Potash uptake may be as high as 10 kg/ha per day and on light, low potash soils this may outpace the soil’s natural capability to supply. In such circumstances spring NK top dressing makes good sense (see PDA Leaflet 22). This is also good practice on these sandy, low K-retentive soils because split autumn and spring application minimises risk of potash loss under excessive winter rainfall. Peak potash uptake with cereals occurs around late flowering stage when there may be more than 300 kg K2O/ha in a high yielding crop. Peak uptake of potash is much greater than offtake at harvest. If this peak requirement is not available, grain number and grain fill will be affected thus prejudicing both yield and quality. This is a key reason for maintaining the adequate soil reserves which can supply these peak amounts more reliably than fresh fertiliser applications.
Pink straw
After flowering, potash is redistributed around the plant with a general reduction from leaves to grain and stem bases. Potash is also returned to the soil with the senescence and shedding of older leaves. The rate at which this potash redistribution process occurs varies widely with different seasons and affects potash levels in the straw.
In the dry summers of 2018 and 2022 the cereal straw had a visible pink hue to it at harvest. Although not directly related to potash offtake, analysis of straw in these years identified high levels of potassium. In these dry years, some of the natural plant processes were not fully completed. Where the grain fill period is shortened, elevated potash levels may remain in the straw at harvest. As the crop matures and senesces the cells of plants crack, allowing some of the potash they contain to be washed back into the soil. Where there is little or no rainfall prior to straw being removed from the field, it will result in elevated nutrient concentrations as less potassium is washed from the harvested straw back to the soil.
Sources and reserves of potash
Virtually all the potash supply to a cereal crop is taken up from the soil. Small quantities of potash (less than 5 kg K2O/ha) are deposited in rainfall, but foliar uptake is not a practical route for the large requirements of this nutrient. Foliar fertiliser applications of potassium to cereals are rarely cost-effective. Potash is held in the soil as the positively charged cation, K+, which occurs in small amounts (less than 20 kg/ha) in the soil solution and in much larger amounts in readily or slowly available form attached to the clay minerals. An even larger quantity is also present within the clay minerals but this can be discounted in terms of crop supply as it is only released over long time periods by weathering. The rate and quantity of potash that a soil can supply for crop uptake depends upon soil type, texture, soil condition and previous history of manuring.

Potash in fertilisers and manures is 90-100% available, but if not taken up by crop roots, becomes held by the clay minerals and is therefore not at risk to leaching in the same way as nitrogen. Research studies have shown that for most soils only 1 kg K is lost for every 100 mm of through drainage. Except on light, shallow soils any movement of potash below plough depth is likely to be retrieved by deeper rooting crops such as winter cereals. Applications of potash in excess of crop need will therefore remain as an increase in readily and slowly available soil K reserves for the next crop.
The soil feeds the crop: fertiliser is used to feed the soil
Nutrient reserves in the soil resulting from natural fertility and previous fertilising and manuring are much more effective in supplying nutrient to the current crop than newly applied fertiliser. Impoverished soils will often not produce the same yields as fertile soils even if higher fertiliser rates are applied. Thus an adequate supply of potash to the crop should be ensured by maintaining an adequate reserve in the soil. Fertiliser (and manures) should be used simply to maintain this reserve by replacing what is removed in the harvested crop. For impoverished soils extra fertiliser can be used to restore fertility to a satisfactory level. Where nutrient levels are more than adequate, fertiliser usage should be reduced below removal levels, or even omitted. Unlike nitrogen and sulphur, soil potash reserves are not subject to loss or major change from season to season and thus maintenance of an adequate reserve is a practical strategy on most soils.
Nutrient removal and balance
Potash
Potash removal in grain
Potassium content of grain is typically 0.5-0.6% K in dry matter for all cereals. This equates to around 5.5 kg of potash (K2O) per tonne of grain at 85% dry matter.
Potash removal in straw
This is of increasing importance as more straw is baled because of economic pressures. Around 90-95% of the barley crop is baled and the reduction in numbers of mixed farms means that a far greater proportion is now sold off farms and not recycled through animals and manure. About 85% of the wheat crop is now baled; this has risen with developing opportunities for sale into industrial uses.
Potash content in straw is much more variable than in grain and is different for winter and spring wheat and barley, and for oats, and is affected by growing conditions and rainfall during and after senescence.
- Effect of cereal species
Winter cereal straw retains less potassium as there is more time for redistribution of potash out of the upper parts of the plant – typical removal is 10.5 kg K2O/t grain. Winter barley, being harvested earlier, often retains more K in the straw than wheat. Typical removal in spring barley and wheat straw is around 12.0 kg K2O/t grain. Both spring and winter oats tend to retain much higher levels of K in straw than other cereals – often with values of over 2% K in dry matter. - Effect of growing conditions
With very dry pre-harvest conditions, the rapid desiccation of the crop can result in less movement of potash out of the straw. For a given yield of straw, potash removal with a hot, dry harvest can be double that of a normal season. Greater quantities of potash are also retained in the plant when the straw stays green right up to harvest and this is believed to contribute to the higher potash values found in oat straw. It is possible that certain agrochemical treatments which preserve green area duration later in crop life will also influence potash retention and thus removal. - Effect of straw yield
Potash removal from the field will obviously increase with straw yield but for practical purposes because straw yields are not normally recorded, typical values for potash removal where both grain and straw are removed are quoted per tonne of grain yield. Straw yield is assumed as a fixed 50% of grain yield, i.e. for every tonne of wheat or barley grain harvested it is assumed that half a tonne of straw is available for baling.
A straw calculator has been added to the P&K nutrient calculator to measure the nutrient impact from the straw alone and calculate the financial cost of removal based on the inputted P & K costs.
Potash balance
It is very useful and quite easy to keep a record of the potash balance for an arable field. Input of total K2O in fertilisers and organic manures and offtake in grain and straw are recorded and the balance is the difference (PDA Leaflet ‘Phosphate and Potash removal by crops’). A negative balance over several years will reduce soil Index and could indicate an impending problem unless the Index is high and being run down intentionally.
Light soils
On light soils, where it is more difficult to maintain potash at a satisfactory level, it is important for cereal growers to note that baling the straw from a typical 7 t/ha barley crop removes an extra 35-45 kg/ha of potash over and above that in the grain. For these soils it is often recommended to top-dress winter-sown crops with some of their potash dressing in the spring, using an NK fertiliser (PDA leaflet 22).
Phosphate
Typical removal in cereal grain is 6.5-8.0 kg P2O5/t. Phosphate content of straw is very much lower than potash. Removal of straw thus has little effect upon phosphate offtake (0.5 kg P2O5/t of grain for wheat and barley, 1 kg for oats).
Typical removal standards
| Crop material | Phosphate (P2O5) (kg/t of fresh material) | Potash (K2O) (kg/t of fresh material) |
|
|---|---|---|---|
| Winter wheat | Grain only | 6.5 | 5.5 |
| Grain & straw | 7.0 | 10.5 | |
| All other cereals | Grain only | 8.0 | 5.5 |
| Winter barley/ triticale/rye | Grain & straw | 8.5 | 10.5 |
| Spring wheat/barley | Grain & straw | 8.5 | 12.0 |
| Oats | Grain & straw | 9.0 | 16.5 |
Sulphur
Immediately available sulphur in the soil can be measured by laboratory analysis, but its susceptibility to leaching as sulphate and its variability both down the soil profile and over time, means that the normal 4 yearly soil analysis (pH, P, K, Mg) regime is not appropriate. Both the organic processes and the leaching potential cause levels to vary by month, and by year. Some research work has been done by measuring sulphur in deep core samples taken for soil mineral nitrogen testing in oilseed rape crops. However, the predictability of potential reserves is still being determined.
Because routine soil analysis cannot be used to predict sulphur deficiency, plant tissue testing is sometimes suggested. For OSR and cereals there is the Malate Sulphate test which can be done early in the crop’s life, but it may need to be repeated later at stem extension. Plant tissue analysis looking at N and S concentrations may also help to give a guide, but the results may not become available until too late to correct for the current crop.
Alternatively, grain analysis for N and S concentrations can be carried out. Although the results will certainly be too late to influence that crop, they should give good guidance for future policy.
Recommendations
The phosphate and potash recommendations below are calculated to achieve full yield and maintain, improve, or reduce soil P and K according to the soil index. The approach firstly identifies the amount of nutrient removed by the cereal crop grown (the ‘maintenance’ amount) and then makes additions to this, if necessary (soil fertility adjustment), according to the current soil index level. Where soils are deficient growers may wish to consider a quicker correction than will be achieved through these standard recommendations by referring to the PDA PK Calculator.


Phosphate
| P Index | 0 | 1 | 2+ | |
|---|---|---|---|---|
| mg/l | 0-9 | 10-15 | >15 | |
| Soil adjustment | All cereals | +60 | +30 | 0 |
| Maintenance (replacement of P removed) | W Wheat – Grain only | Yield x 6.5 | ||
| W Wheat – Grain & straw | Yield x 7.0 | |||
| All other cereals – Grain only | Yield x 8.0 | |||
| Winter barley/triticale/rye/spring wheat/spring barley – Grain & straw | Yield x 8.5 | |||
| Oats – Grain & straw | Yield x 9.0 | |||
| Yield in t/ha, application rates in kg/ha | ||||
Potash
| K Index | 0 | 1 | 2 and above | |
|---|---|---|---|---|
| mg/l | 0-60 | 61-120 | >120 | |
| Soil adjustment | All cereals | +60 | +30 | 0 |
| Maintenance (replacement of P removed) | All cereals – Grain only | Yield x 5.5 | ||
| Winter wheat/barley/triticale/ rye – Grain & straw | Yield x 10.5 | |||
| Spring wheat/spring barley – Grain & straw | Yield x 12.0 | |||
| Oats – Grain & straw | Yield x 16.5 | |||
| Yield in t/ha, application rates in kg/ha | ||||
Sulphur
Recommendations are only guides due to the variable nature of crop-available sulphur coming from soils for plant uptake. The table below is adapted from the AHDB Nutrient Management Guide and identifies the risk of sulphur deficiency dependant on soil type and over winter rainfall. Where sulphur is needed cereals should receive 25-50 kg SO3/ha.
Estimating the risk of sulphur deficiency for cereal crops (Source: AHDB)
| Soil texture | Winter rainfall (Nov-Feb) | ||
|---|---|---|---|
| Low (<175mm) | Medium (175-375mm) | High (>375mm) |
|
| Sandy | High | ||
| Loamy & coarse silty | Lower | High | |
| Clay, fine silty or peaty | Lower | High | |
The crop requirement for sulphur is directly related to the nitrogen uptake as both are essential constituents of all proteins. While plants synthesise the proteins needed for their functioning, the protein in grain, such as in milling wheat and malting barley, is a major component of the quality of the output. Sufficient available sulphur is essential for the complete synthesis of true protein and a shortage will result in the presence of free amino acids in the grain, including asparagine. This is a precursor to the formation of the carcinogen acrylamide, an unwanted contaminant in processed grain. A recent (2023) paper from Rothamsted states that “given the necessity of preventing free asparagine accumulation in all conditions, it is recommended that sulphur-containing fertiliser be applied to cereals at a rate of 50 kg SO3/ha”.
Recommendation adjustments
Sand soils
It is not economic to increase soil K beyond 100 mg/l (upper K Index 1) on these soils because of their very low capacity to hold nutrients. Improvement can be achieved by many years dressing with FYM. Nutrients should be applied ‘little and often’ on these soils (see PDA Leaflet 22).
Loamy sands
It is not economic to increase soil K beyond 150 mg/l (mid K Index 2-) on these soils because of their low capacity to hold nutrients. Improvement can be achieved by many years dressing with FYM (see PDA Leaflet 22).
Shallow soils
On shallow soils, such as some chalk/limestone soils, there can be greater risk of loss of potash, even though they have a higher clay content than sandy soils, because of their depth and a high proportion of stone in the topsoil (both these factors restrict the volume of soil for nutrient retention). Target fertility in these cases must be adjusted as with other low retentive soils.
K releasing clay soils
Some clay soils can release potash over many years. Normal potash rates can be reduced by 50 kg K2O/ha.
Manures
Only about 20% of winter cereals and 30% of spring barley nationally receive any manure but it is important that nutrient contribution from this source is estimated, and fertiliser use adjusted accordingly. Whilst there are often higher priorities for manure use, e.g. for roots, vegetables and conserved forage crops, regular measured applications of manure will benefit cereal crops, especially on the extremes of soil type – very light or very heavy – by improvement of physical characteristics of the soil as well as by nutrient supply.
Timing
Phosphate
Because phosphate helps root development it is important to ensure adequate supplies of P are available for the developing root system. Unfortunately, phosphate is a very immobile nutrient and roots have to grow to where the phosphate is rather than the reverse. Water soluble phosphate in fertilisers may also become less available fairly rapidly following application in some soils. Hence where soil P is less than adequate, i.e. at less than index 2, phosphate should be applied in the seedbed and at very low soil index is best placed near to the seed. This is of greatest importance on heavy soils and soils with poor structure, as root extension to find the P is even more difficult on such soils. However, under good soil and climatic conditions, for soils at the target level of Index 2, maintenance dressings can generally be applied at any time during the growing season, except with cold-temperature-sensitive crops such as maize when placement near the seed will usually be beneficial. Rotational manuring may also be considered but policies involving large amounts of phosphate at one time are not desirable if there is any risk of loss of run-off or soil erosion.
| Soil P (Olsen test) | Timing guidelines |
|---|---|
| Under 14 mg P/litre | All in seedbed |
| 14-18 mg P/litre | Annually, in seedbed or in spring |
| Over 18 mg P/litre | At any time (rotational manuring possible) |
Potash
Whilst this nutrient is slightly more mobile than phosphate it is still good policy to apply potash at or before drilling where soil reserves are low. In these circumstances on heavy soils or where soil structure is poor and nutrients may be less easily accessed by roots, all the requirement for potash is best applied at or before drilling. For light and shallow soils, where fertiliser needs are often high because of a low soil Index, it is good practice to split applications for winter cereals, with some in the seedbed and the remainder accompanying nitrogen top dressing in the spring (see PDA Leaflet 22). This ensures a supply at establishment, avoids possible risk of downward movement over winter, provides the beneficial combination of nitrogen and potash to assist rapid uptake in the spring and permits more flexibility of product choice to provide optimum rates of phosphate and potash. For soils with adequate reserves, i.e. at a soil Index of 2, potash requirements can be applied at any time as the objective is simply to replenish soil levels for the following crop. Rotational manuring may be attractive but whilst there are no environmental concerns with potash, large single dressings are unwise on light or shallow soils because of risk of loss.
| Soil K | Crop | Timing Guidelines |
|---|---|---|
| Under 100 mg K/litre | Winter cereals | Light soils: 50% in seedbed, rest in spring |
| Other soils: all in the seedbed | ||
| Spring cereals | Light soils: between January & sowing | |
| Other soils: between autumn & sowing | ||
| 100-150 mg K/litre | All cereals | Annually, at any time |
| Over 150 mg K/litre | All cereals | At any time (rotational manuring possible) |
Sulphur
Generally, sulphur recommendations for cereals in the sulphate form, suggest it should be applied in March or April, usually, but not exclusively, along with the nitrogen application. Organic sulphur, including through applications of manures, which needs to be mineralised by microbes in the soil, are often applied in the autumn. Due to the process relying on biological activity in the soil, the timing of the availability of mineralised sulphate, as with nitrate, will be uncertain.
Recently, Polysulphate has become available to the market, which is a naturally occurring mineral providing crop available sulphate sulphur. Due to the reduced rate of dissolution of its complex sulphate crystal, there is an extended release period of the nutrients. The prolonged release pattern of the sulphate from Polysulphate allows the application of a single dressing of sulphate in early spring without major risk of loss of sulphate by leaching. Autumn applications are also being trialled, where improvements in establishment and uptake of nutrients have been measured.
Magnesium
At Mg Index 0, magnesium fertiliser should be applied every 3–4 years at 50–100 kg MgO/ha. Where liming is also required, magnesium can be supplied through the occasional use of dolomitic (magnesian) limestone.